In Part 1 of this series of 3 blog posts we introduced the specific performance challenges OpenJDK faces lowering application ‘startup’, ‘warmup’ and ‘initial footprint’ costs and provided an overview of what Leyden is doing to address those challenges.
Part 2 described how to use the new capabilities offered by Leyden and presented test results which show that very significant progress has already been made and is set to continue.
Part 3 provides a more detailed account of how Leyden’s proposed solution operates and presents a first look at tooling that allows you to assess the benefits that result and tune your application to make the most of what Leyden offers.
What is inside the Ahead of Time Cache?#
Ideally, an AOT cache would simply include everything needed to allow a production run to skip straight through to its warmed up state. However, in practice training runs don’t always cover all the things that can happen at runtime and hence that the assets contained in any generated AOT cache will be more or less complete.
In order to have some idea of how effective a training run has been it’s helpful to be able to look at a cache and see what is in it. Full details of the tooling that allows you to do that are presented in part 3 of this blog series. However, in order to prepare for that, we need to provide an overview of the JVM assets that end up in the cache and how the JVM uses them. We will follow up with some examples to show how effectively this improves startup and warmup.
So, let’s take a deeper look at what exactly is inside the AOT Cache. There are several different ways of classifying the contents:
The most straightforward way to classify AOT cache assets is to distinguish between Static and Dynamic data.
Static assets are data that are available in or directly derived from bytecode, data that exist, even if only implicitly, at build time.
Dynamic assets are data that get generated, or are collected, at runtime as a side-effect of execution. Some of them record information that can be used to trigger compilation and drive feedback-driven optimizations, including speculative optimization, beyond what an ahead-of-time compiler would be able to do. They can also include the compiled code that is generated as a result of that compilation.
Finally, they include training data, created as a training run progresses to track what the JVM has done and why. Training data identify what JVM assets need to be stored into the cache when it is created. They are also installed in the cache, indexing the other assets and helping identify how to use them in production.
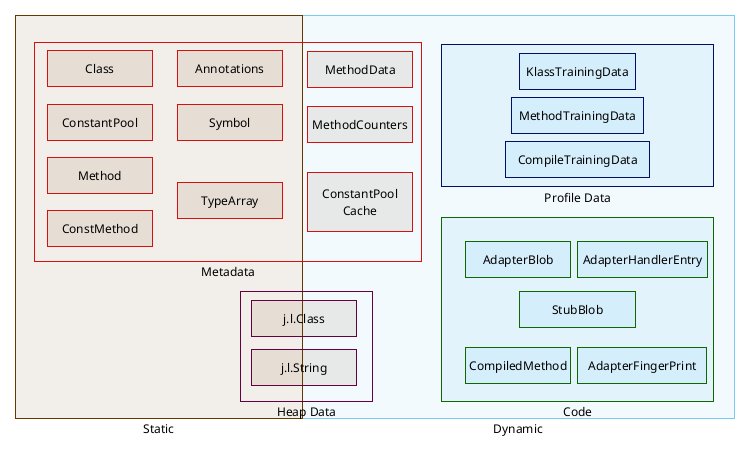
We can also distinguish two types of data depending on their purpose:
On one hand, there is the JVM data — metadata, heap data and code. This is a network of C++ objects that are used during normal JVM running to define and regulate Java execution. These objects must always exist, even when running without a cache, in order for the JVM to be able to run an app. This object network needs to be dumped to the archive on disk in a format that allows it to be quickly and correctly restored to the relevant memory areas of the production JVM in a valid (C++ Object) format and layout that matches the JVM’s expectations.
On the other hand we also have Leyden’s own Cache Management Data, i.e. training data, which exists specifically to support creation and consumption of AOT cache. Training data are also saved and restored as C++ object data but the format and layout of these objects is determined solely by the Leyden cache management code. Its sole purpose is to track and regulate what assets get written to the AOT cache after training completes and what assets can or should be restored in production.
Let’s see in detail what each data type means.
Metadata stored in the AOT cache is a superset of what was stored in a CDS archive. The subset which overlaps with CDS is the static metadata. The latter represents the structure and hierarchy of classes in JDK and application code. Primarily, it helps avoid the cost of parsing bytecode, as it is in the same format as the JVM’s own internal metadata model: classes, methods, fields, inheritance between classes,… which can be mapped directly into memory. Having this information stored in the cache speeds up the time the Hotspot takes to decode the different class files, and to build the dependency graph.
While starting the application, the Java Heap memory gets filled with objects and instances that are going to be used during runtime. Some of those heap data objects can be cached too because they are quite predictable, like Strings hardcoded in the source code, java.lang.Class instances, some content of class static fields, objects needed to run lambdas, the class graph module,… Those are all assets that are created in memory in the same way on every run.
The heap data cached at the moment is restricted to very specific cases as it has to behave exactly the same on each and every run, but the type of data cached is expanding on each JDK version.
JVM Profile and Linkage Data#
The cache also includes dynamic JVM metadata i.e. MethodCounter, MethodData and ConstantPoolCache objects. These objects are created and attached to the static metadata methods and classes and their content is updated as a side-effect of executing method code.
MethodCounter objects track how often the method they are attached to has been called. They are primarily used to trigger compilation via the baseline (C1) or optimizing (C2) compiler. The interpreter increments a method’s call count up to a threshold before scheduling a C1 compile, possibly including code that gathers further profile information. Instrumentation code in (Tier 2 andImage description 3) C1 compiled methods also updates the call count and when a higher threshold is reached either upgrades to (Tier 4) C2 compiled code or reverts to (Tier 1) C1 compiled code which includes no instrumentation
MethodProfile objects record detailed information about their associated method’s hot and cold paths, argument types and other details of how it executes, most notably any history of speculative deoptimization. Apart from the deoptimization case, which applies for both C1 and C2 code, MethodProfile objects only receive updates via instrumentation code in (Tier 2 and 3) C1 compiled methods.
ConstantPoolCache objects are attached to a clasImage descriptions and track the linkage of call and field access sites in any of the class’s methods. Prelinking avoids work at the first call or first field access and this is especially valuable when the call is an invokedynamic i.e. the bytecode that implements a lambda invocation.
Linking a lambda involves running Java ‘bootstrap’ code that identifies a private class that owns the bytecode for the lambda body, asking it to construct and return a MethodHandle that can be used to execute the target. If a lambda can be run during training then the target class and method can be pre-loaded and the MethodHandle stored in the heap and linked from the ConstantPoolCache, avoiding the need to run the ‘bootstrap’ in production. If the lambda is executed repeatedly in production the called bytecode may even be inlined into the compiled code for the caller. Effectively, executing as lambda in training removes all setup overheads in production, making lambdas as cheap to use as a direct method call.
JVM Code and Code Management Data#
AdapterHandlers are a set of utilities used by the Hotspot to marshall method parameters when performing certain types of call. AdapterHandlers can be cached, avoiding the need to generate them on demand. They are identified by their AdapterFingerprint and indexed via a table of AdapterHandleEntry objects.
Alongside these handlers various StubBlobs needed by the runtime are also cached. These blobs contain JITted code that implements one or more ‘stub’ routines. Stub routines include architecture- and OS-specific code used by the JVM to perform operations that are hard to write in a platform agnostic way. Examples include: flushing code regions after update by the JIT or call linker, unwinding the stack when an exception occurs, replacing a compiled stackframe with one or more interpreter frames when execution of a deopt trap forces a bail-out etc. There are also many stubs that provide hand crafted, high-performance implementations of math, crypto or memory copy methods that are used in place of Java implementations on some architectures, especially where hand-crafted code can use specialized hardware instructions to outperform the JIT compiler. Much of the stub and adapter code has to be generated before the JDK can fully startup. Storing it in the cache and reloading it in production provides a small but noticeable performance improvement.
Leyden premain also includes CompiledMethods, i.e. pre-compiled Java methods, in the cache. This includes both C1 and C2 (Tiers 1 - 4) and in some cases different tier compiled versions of the same method. Having compiled code immediately available, especially Tier 4 code, is an enormous boost to performance. Lower tier code may be useful when the method only reached that tier during training or as a fallback if we need to deoptimize and reprofile. Pre-compiled Java methods are an enhancement we expect to add soon to the mainline JDK.
Leyden Training Data#
Training data is part of the Leyden specific code. It tracks which methods have actually been loaded, executed, and used during the training run and how they have been used. Normally all loaded classes have associated class training data, but these may be omitted if, say, the class is loaded by a custom (user-defined) loader, is modified by an agent or fails to resolve because of linkage errors.There is a usage threshold which means that only methods that have been executed above that threshold will have associated method training data. Likewise, compiled method training data only exists for methods actually compiled during training. This helps both in keeping a smaller footprint in the cache and removing less useful data so processing the cache is faster.
How Do I Know Leyden Is Helping?#
Depending on how well you train your deployment you may see different improvements in time to reach application start (startup time) and time to reach peak performance (warmup time). Log output is one useful way to measure these two metrics but the details will depend on what monitoring capabilities are available in your test or production environment. However, simply measuring these two times (or even recording warmup profiles) doesn’t help with the problem of explaining why, for some given training regime, you get a specific improvement or perhaps, in some cases, no measurable improvement.
For any given AOT cache (or set of alternative caches) it is very helpful to have some idea of what assets were included or excluded in the training set, which ones were written into the cache and what benefit they provide during a production run. In particular, it is useful to have both aggregate statistics and information on individual assets and their relationships. The Leyden project has provided a tool precisely to address these needs. Let’s see a practical example of how to diagnose an AOT Cache.
For the purpose of this article, we are going to use the following example application: https://github.com/Delawen/bad-good-cache
This is a web application that has a simple API and a basic html interface to use it.
The first thing we need to do is to compile this application on the root folder:
$ mvn clean package
Training the application#
Once we have the jar created, we use it to start a training run:
$ java -XX:AOTCacheOutput=target/app.aot -Xlog:aot+map=trace,aot+map+oops=trace:file=target/aot.map:none:filesize=0 -Xlog:class+load=info,aot+resolve*=trace,aot+codecache+exit=debug,aot*=warning:file=target/training.log:level,tags -jar target/quarkus-app/quarkus-run.jar
The arguments we are going to use are the following:
- -XX:AOTCacheOutput=target/app.aot Which will create an AOT file called
app.aot
- -Xlog:aot+map=trace,aot+map+oops=trace:file=target/aot.map:none:filesize=0 Which will create a map file that indexes and describes the previously created AOT file.
- -Xlog:class+load=info,aot+resolve*=trace,aot+codecache+exit=debug,aot*=warning:file=target/training.log:level,tags Which will generate training log files with relevant information
To help us train the application, we are going to use the `oha` tool, that helps us run a series of requests that will showcase a user using the application:
$ oha --urls-from-file src/main/resources/urls.txt -n 100
Now that we have trained the application, let’s stop it with ctrl+c. It will take some time to stop while it builds the cache. It will do both the training and assembly steps at once.
We should have created three types of files:
- target/app.aot : The AOT cache itself
- target/aot.map : The map file
- target/training.log : The logs for the training run
Now that we have the AOT cache, we can start a production run, in which we will also save log files:
$ exit
The arguments we are going to use are the following:
- -XX:AOTCache=target/app.aot Make use of the AOT file called
app.aot
- -Xlog:class+load=info,aot+resolve*=trace,aot+codecache+exit=debug,aot*=warning:file=target/production.log:level,tags Which will generate a production log file with relevant information
And we can use the application normally. Let’s play a bit on http://localhost:8080/
On this run, we created the production.log file.
Analyzing the Cache#
After using it, we can stop it and analyze how the AOT Cache behaved with our AOT Cache diagnostics tool: https://github.com/Delawen/leyden-analyzer
The first step is loading all the information into the tool, to run a proper analysis:
> load aotCache --background target/aot.map
> load trainingLog --background target/training.log*
> load productionLog --background target/production.log*
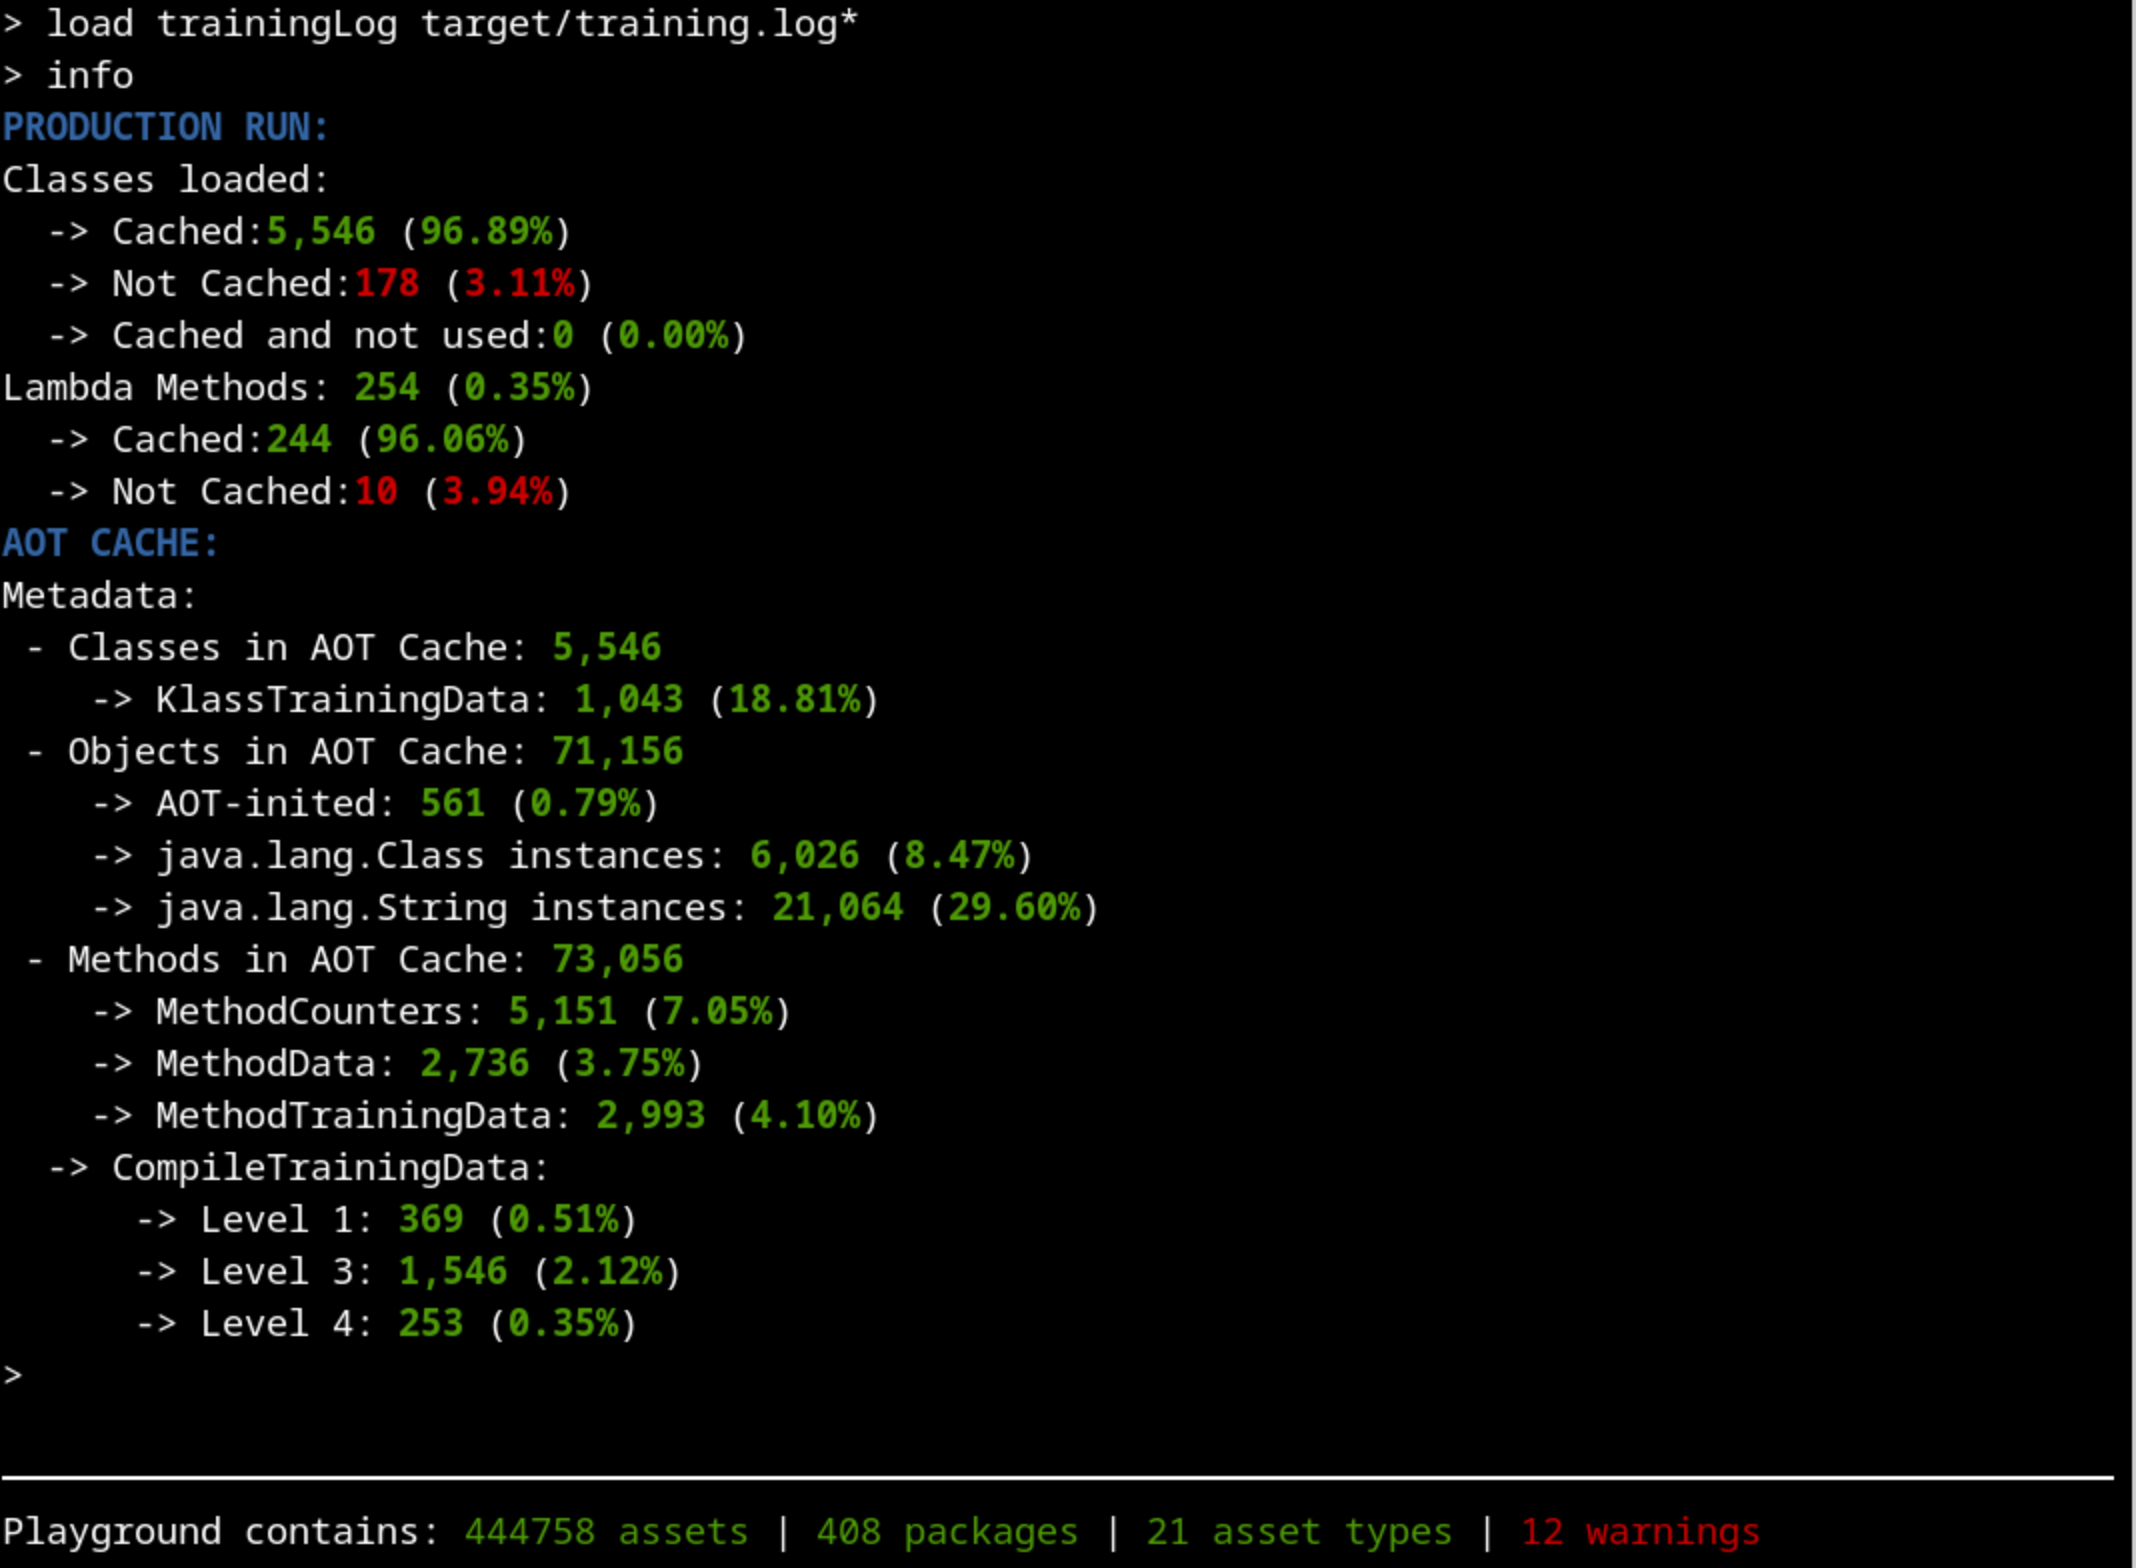
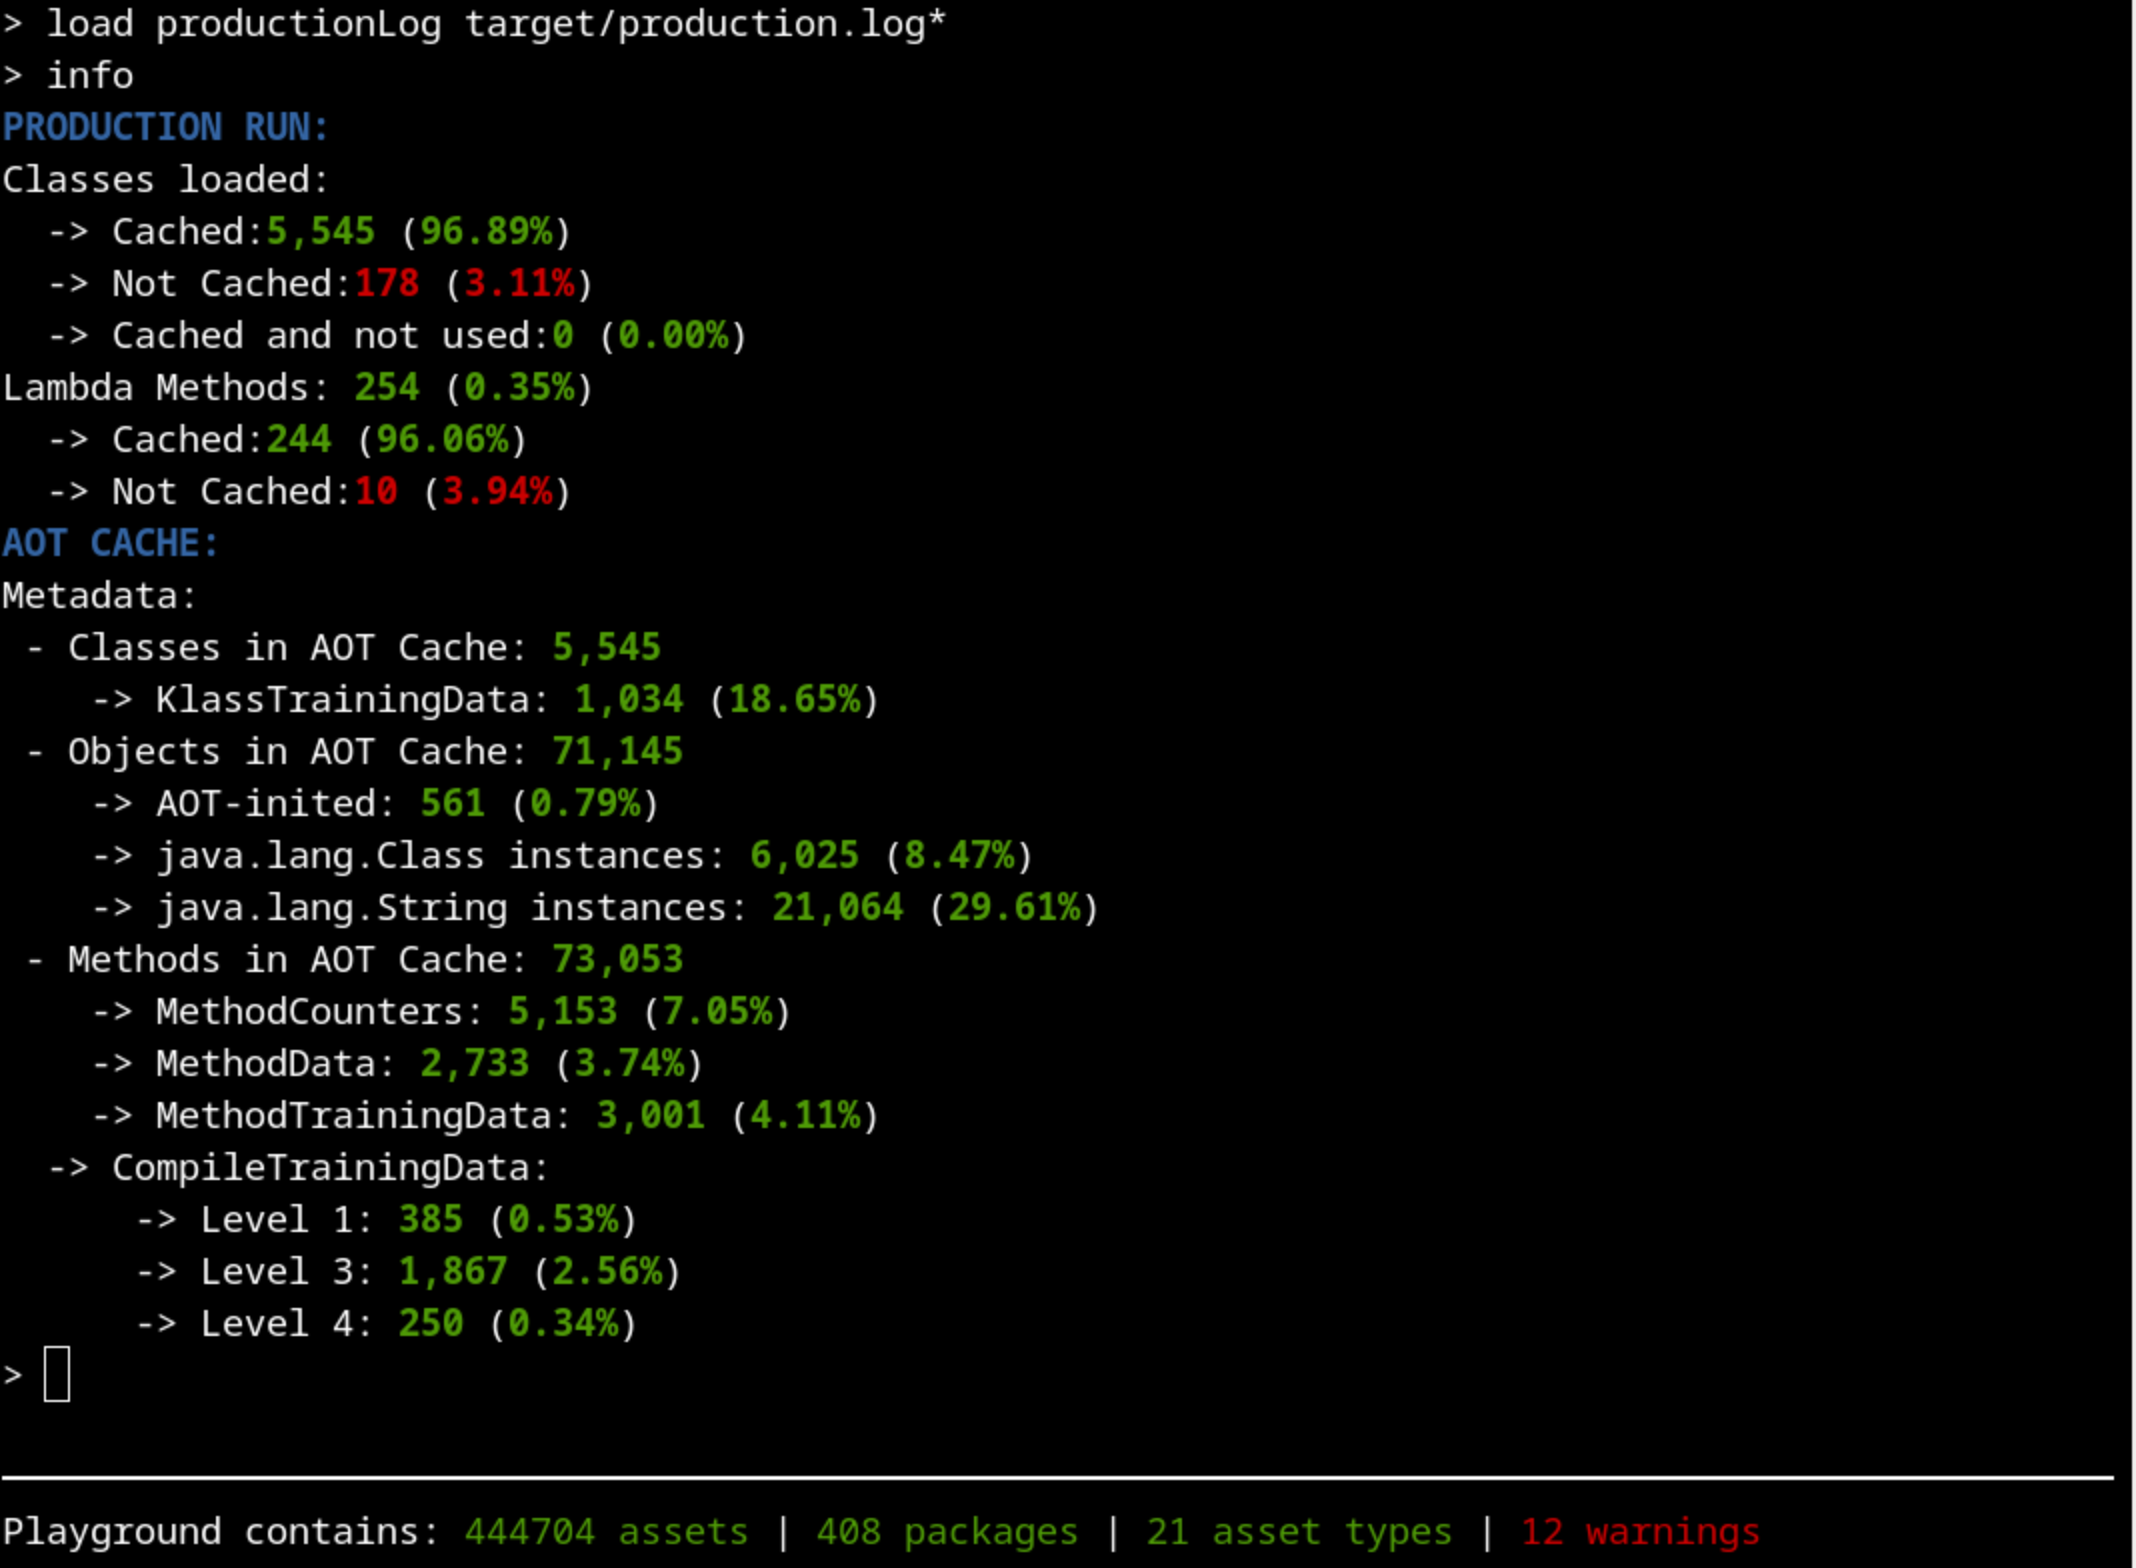
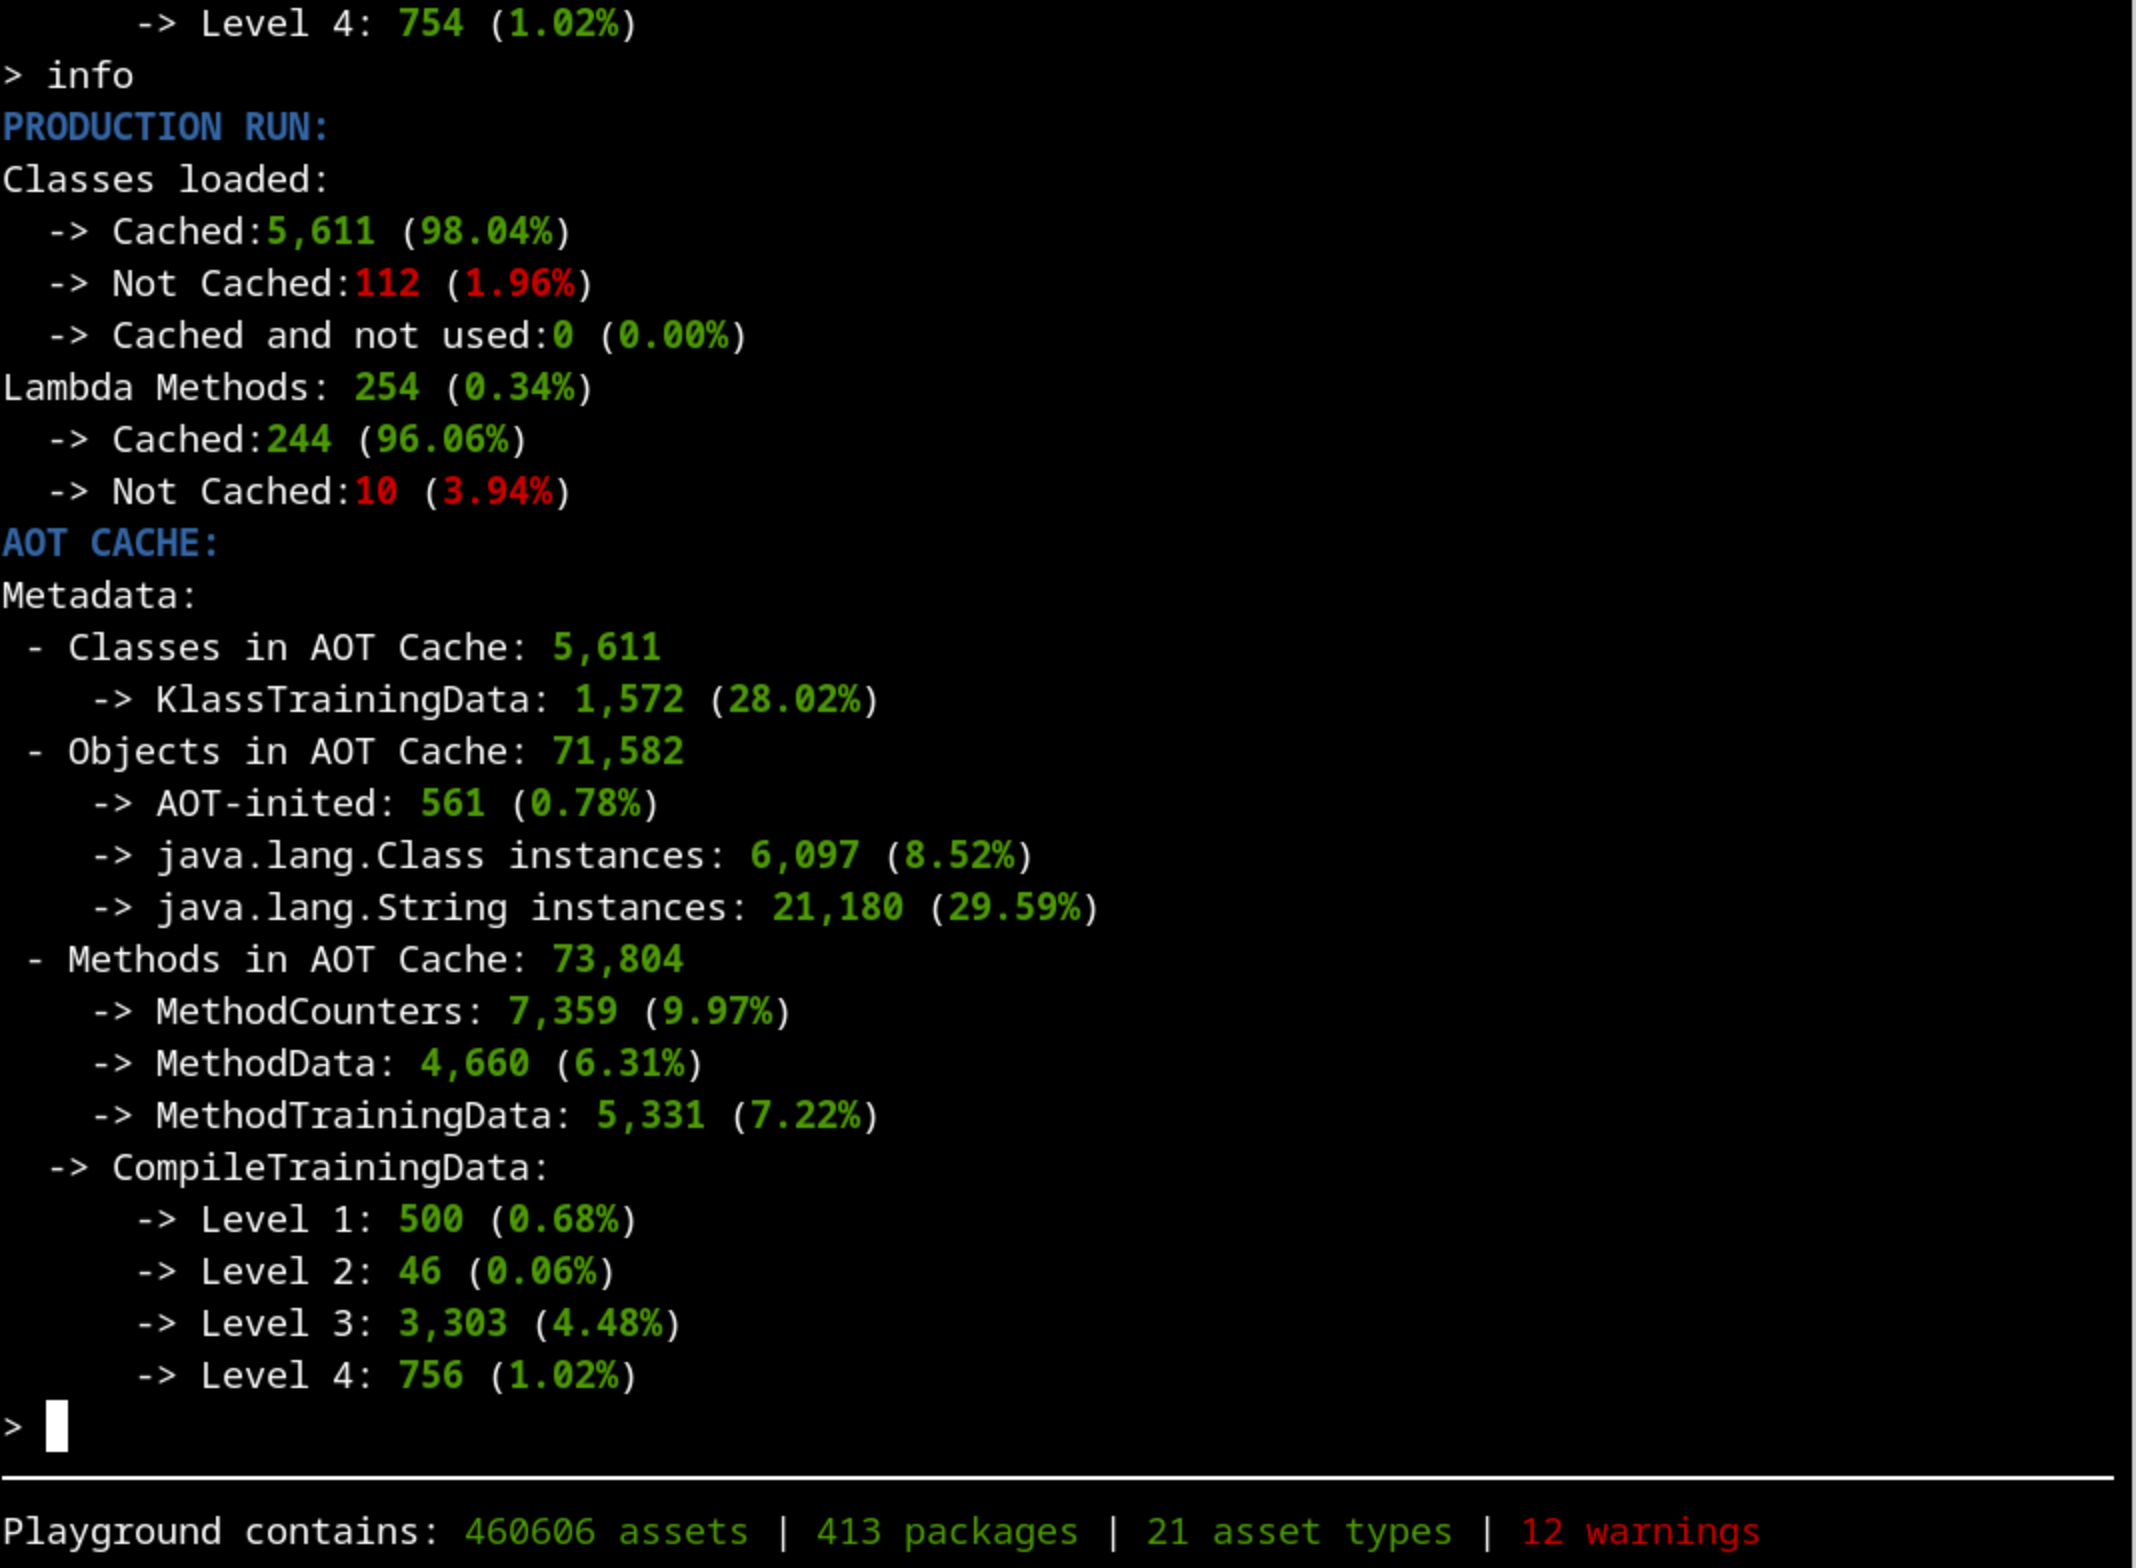
Now we are ready to start our analysis. A good place to start is the info command that shows a summarized version of what is inside the cache:
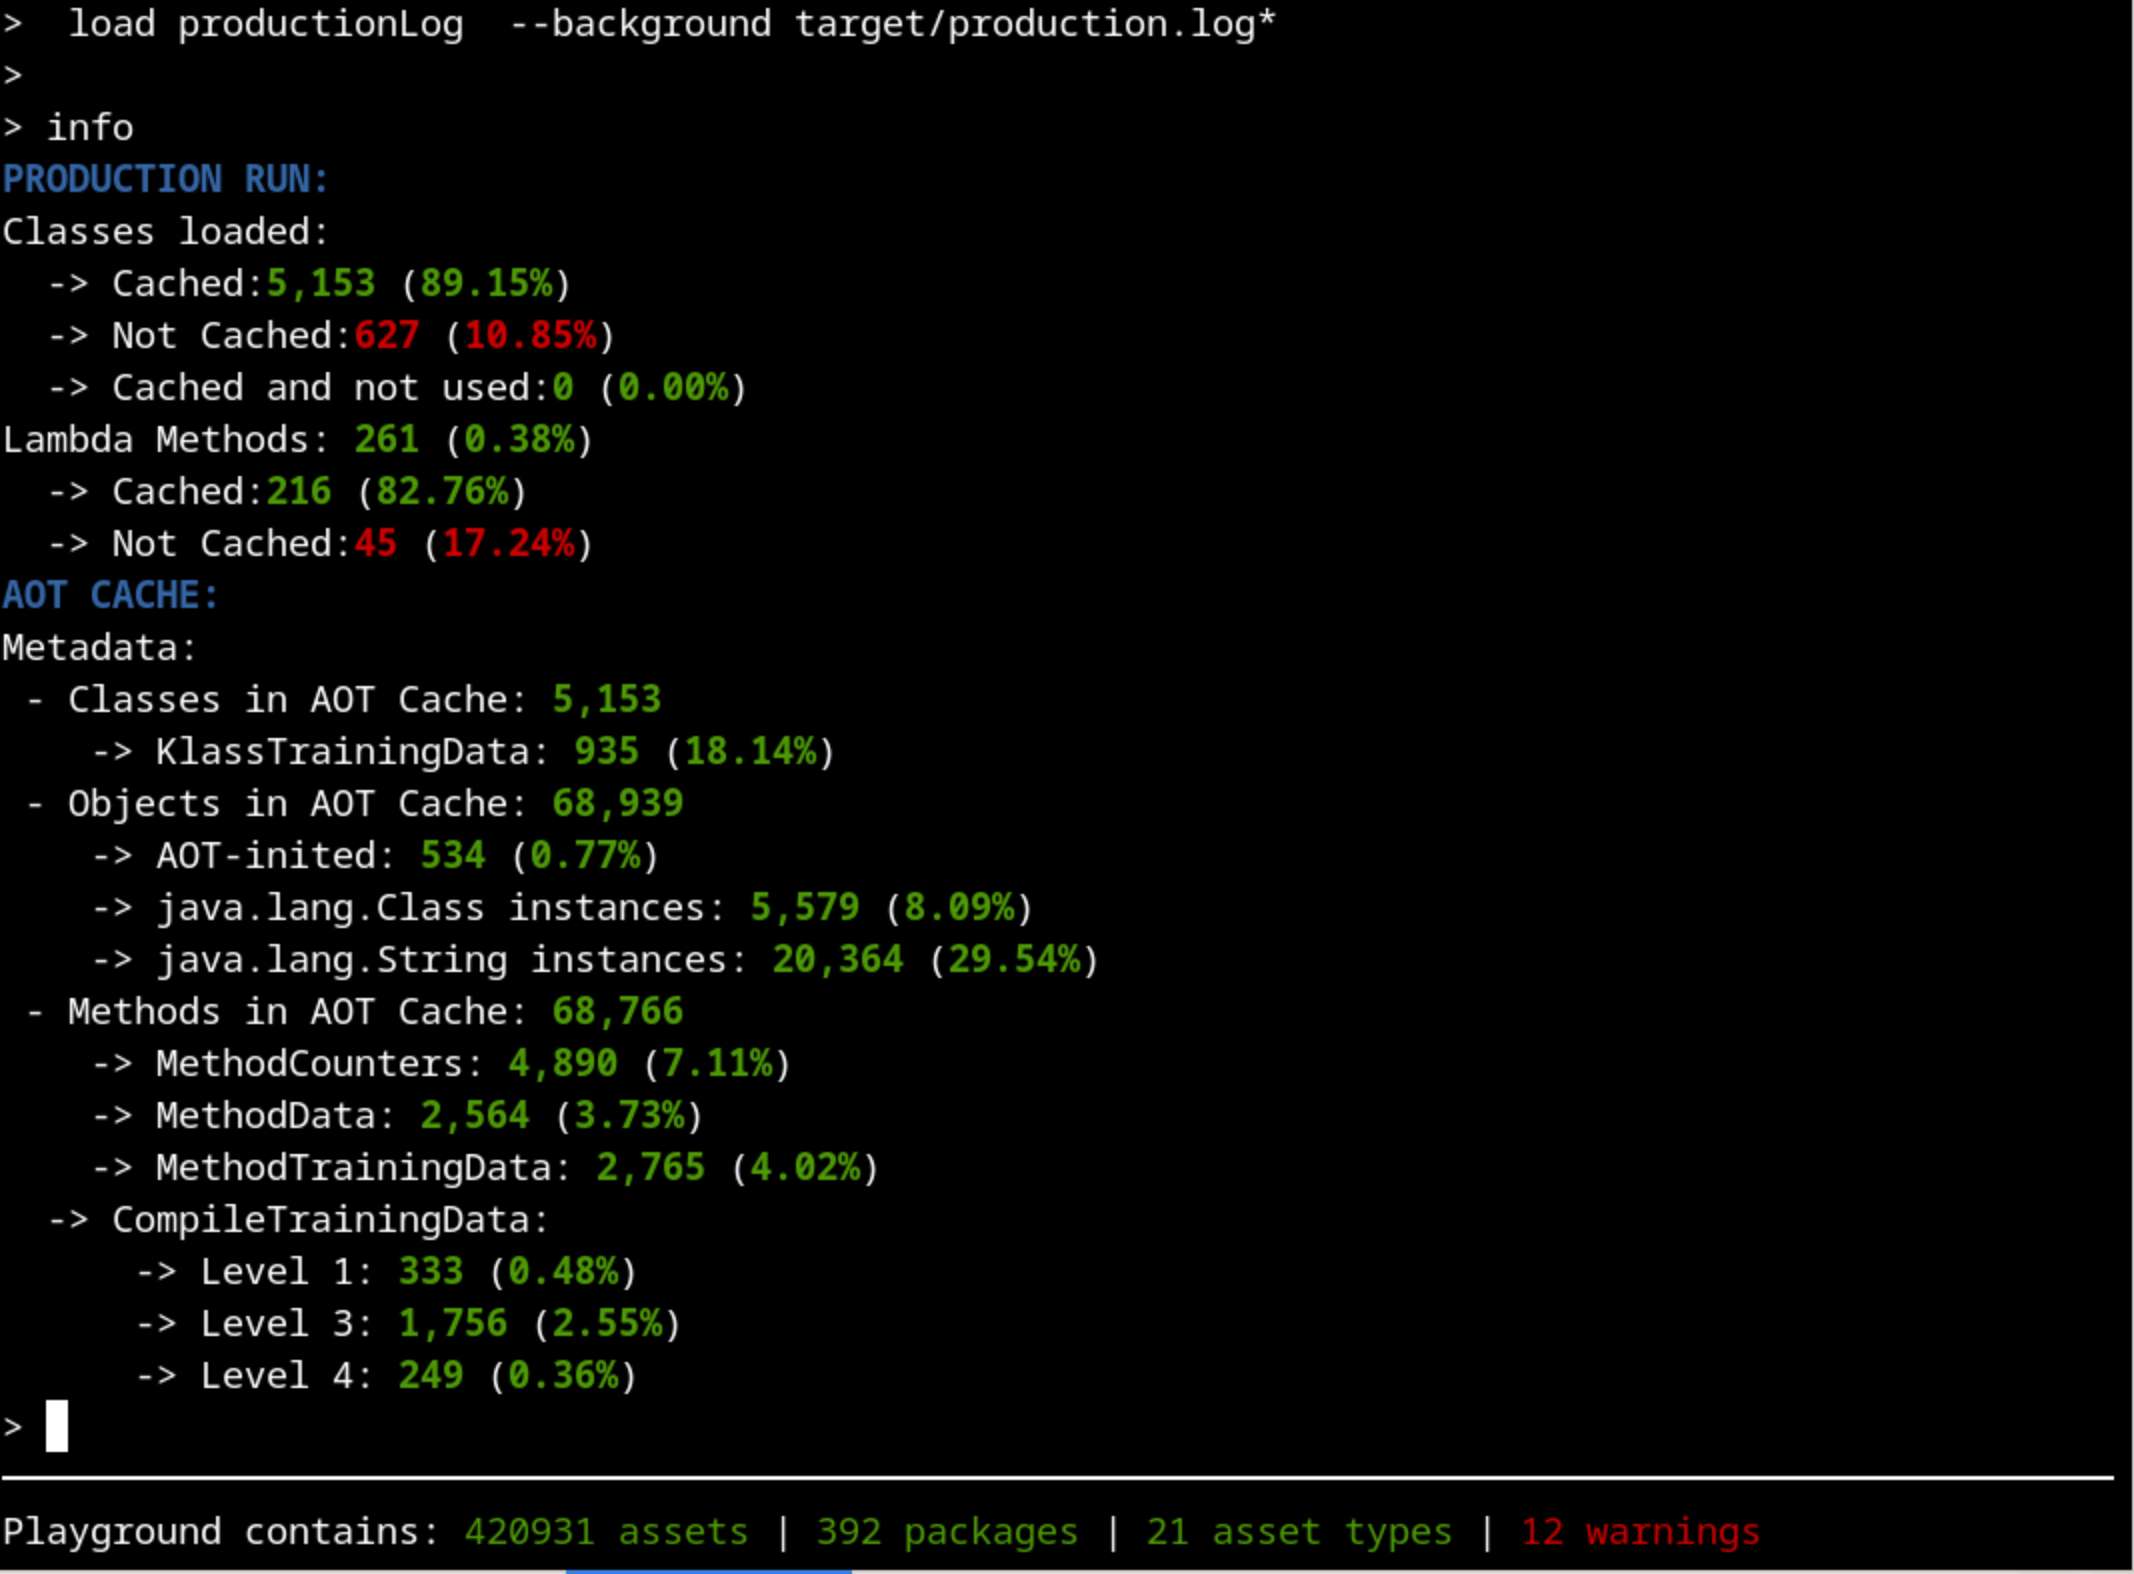
Are we training the right thing?#
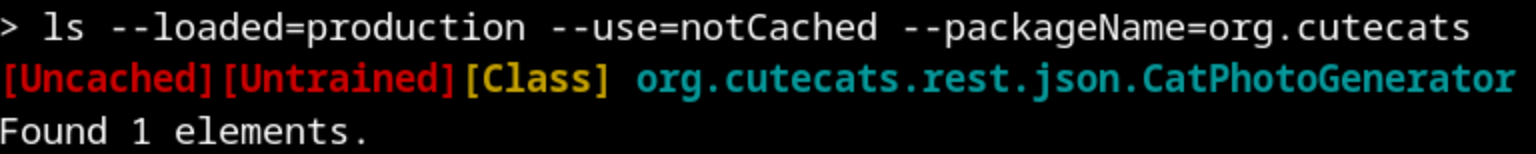
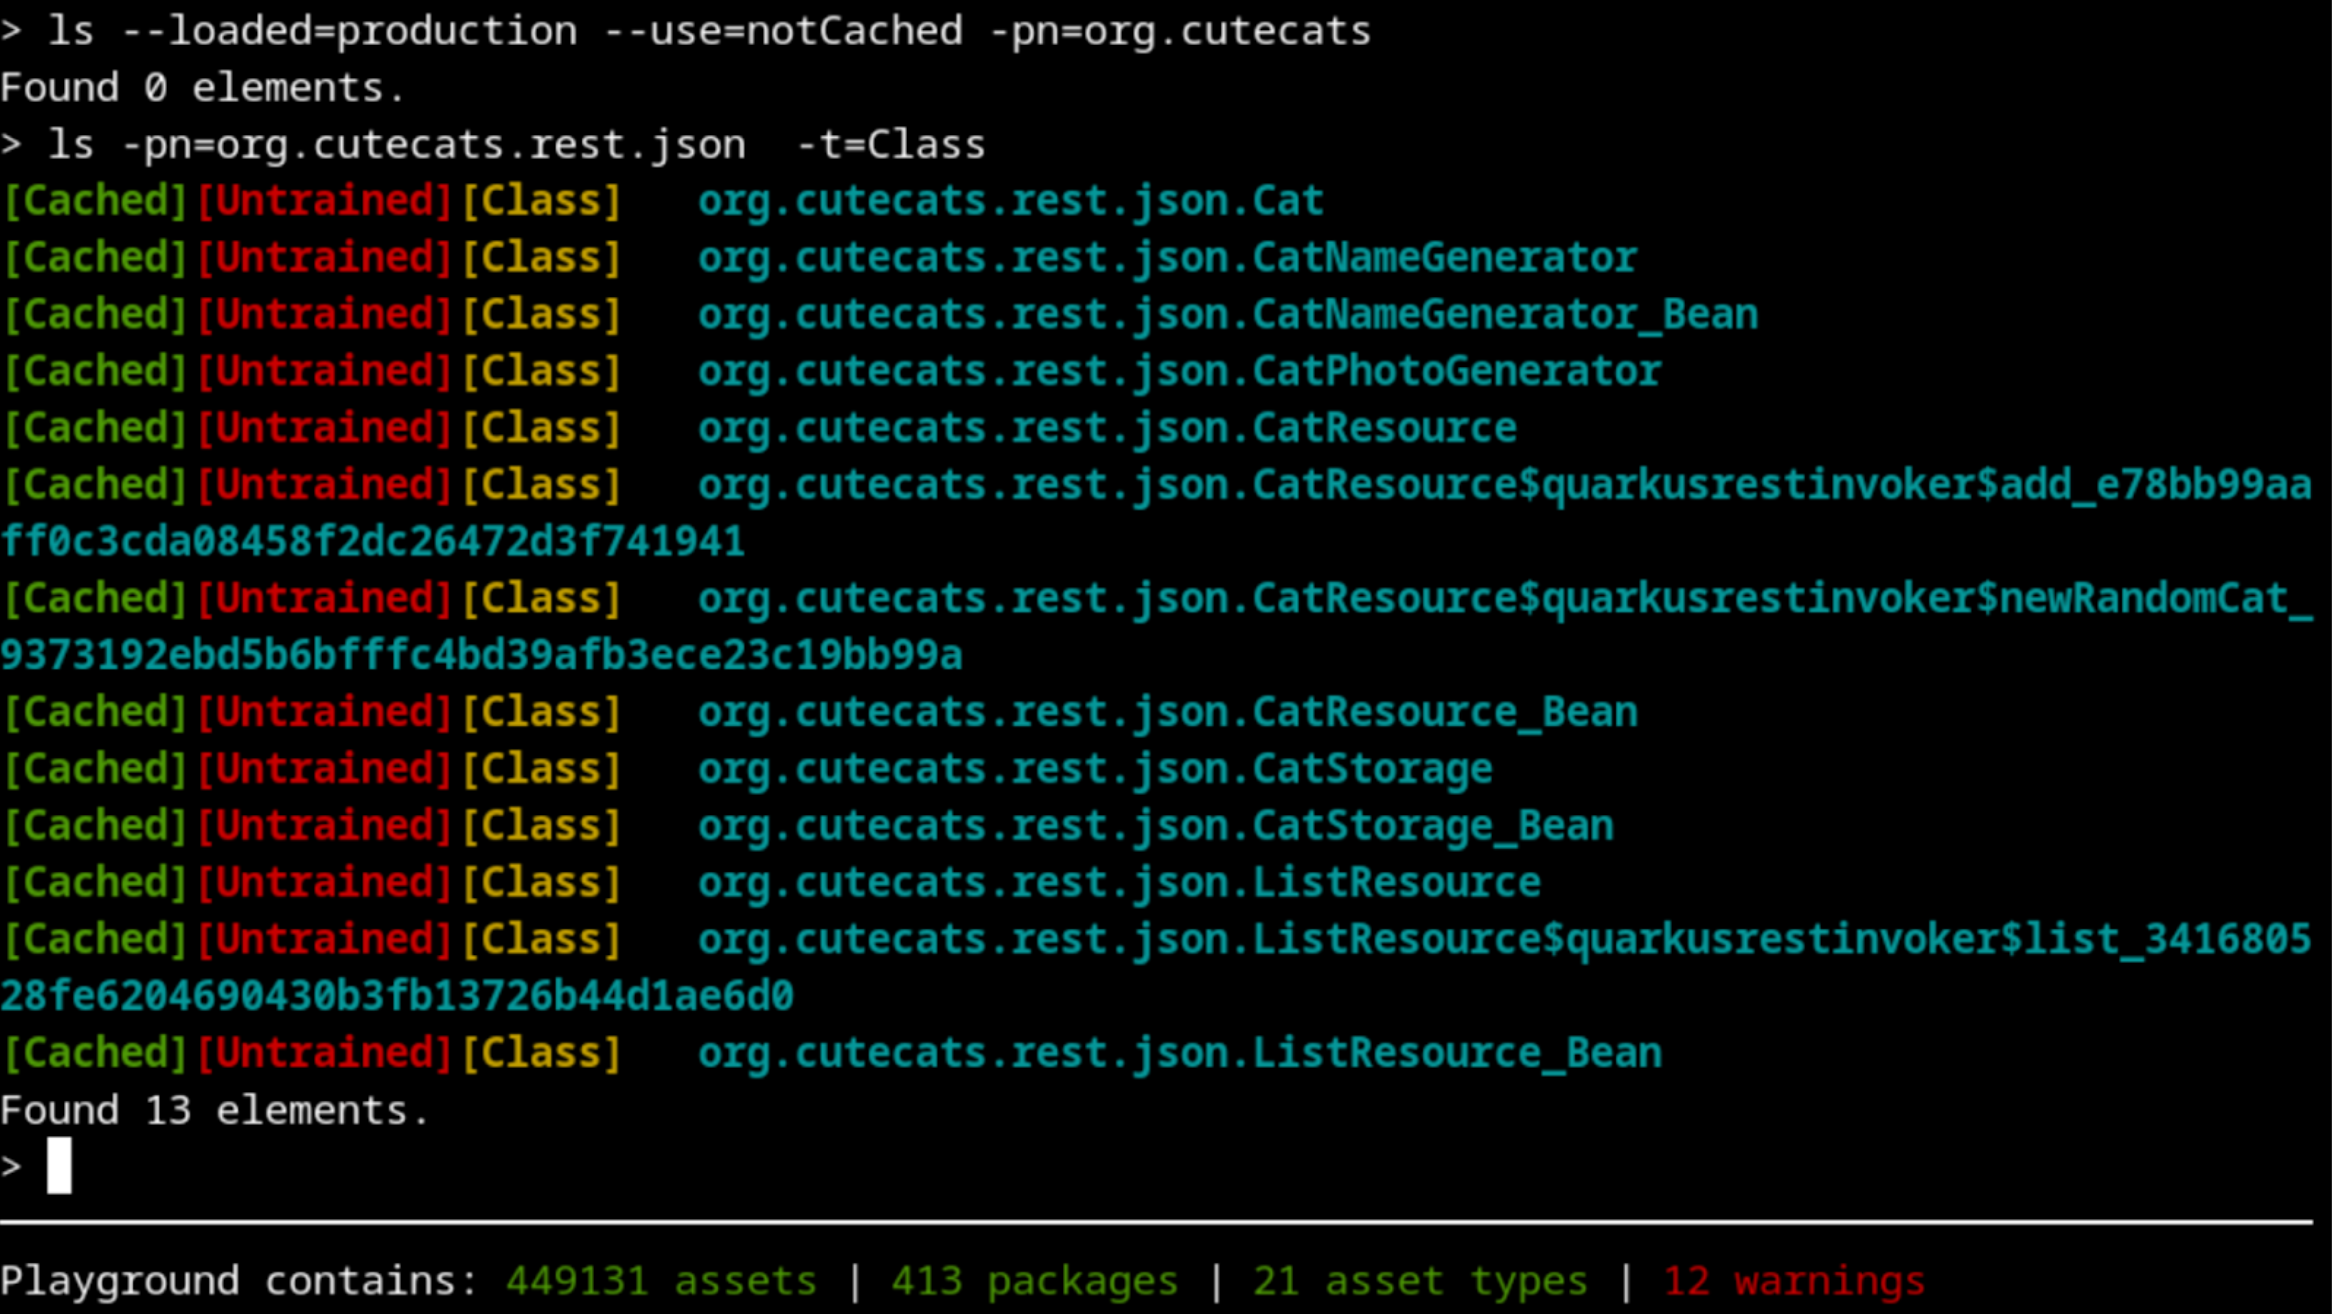
The first thing that should catch our attention is that there’s more than 10% of classes that were used on the production run but were not cached. That’s not usual, so let’s dig into whatImage description those classes are. There are hundreds of them, so if we filter by our package name, that would make our exploration easier:

What does this mean? Let’s take a closer look:
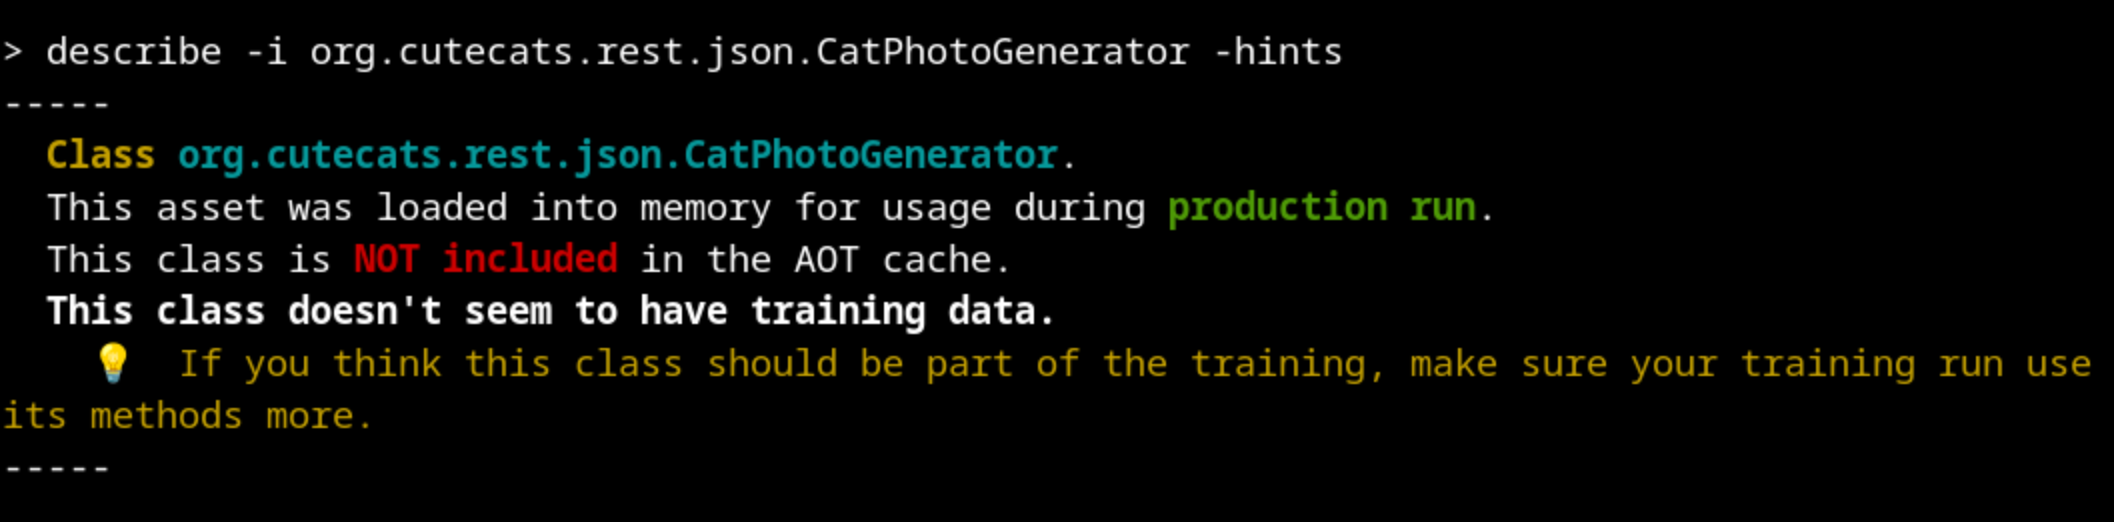 This class was not loaded during training but it was loaded during production. Something went wrong with our training.
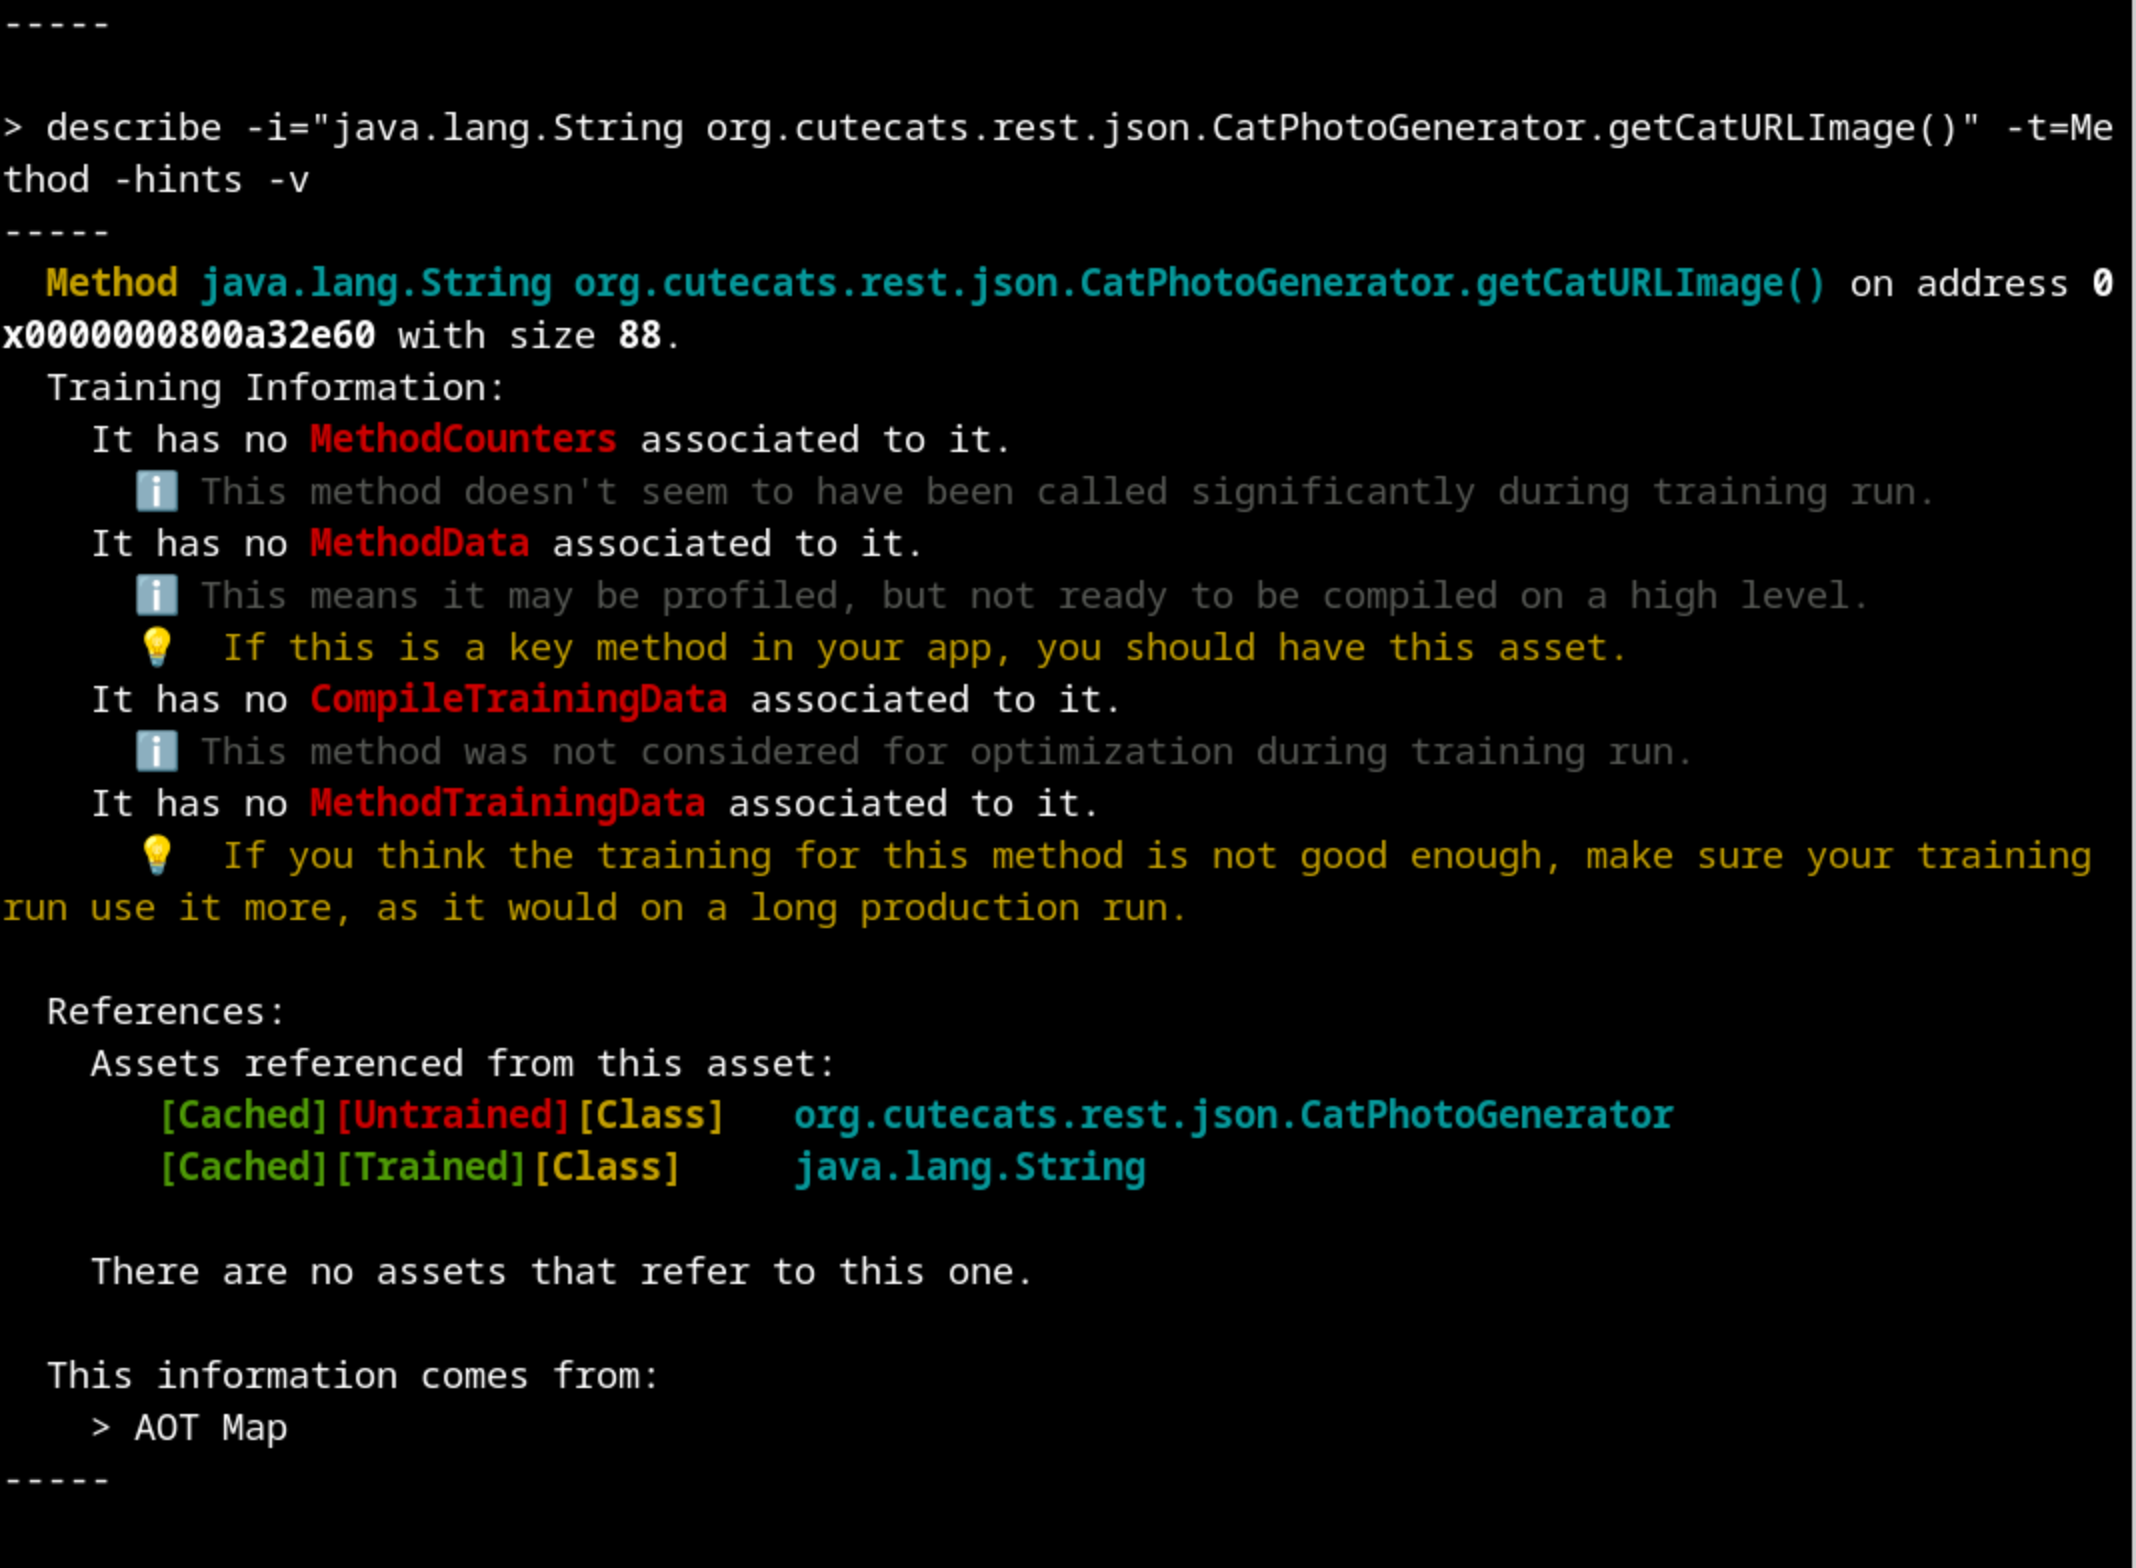
We can explore the class org.cutecats.rest.json.CatPhotoGenerator by looking at the source code. There, we discover that it should be used by org.cutecats.rest.json.CatResource.
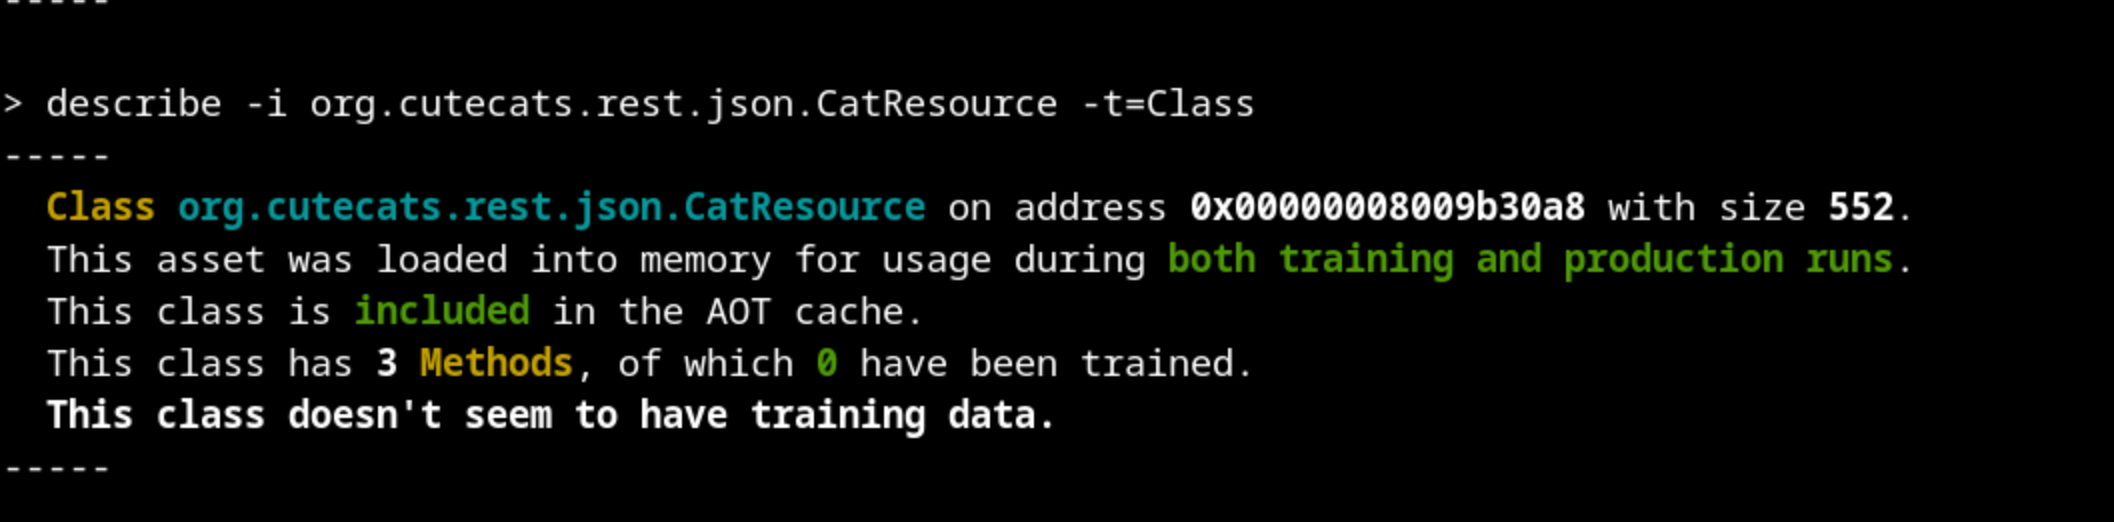
So, this class was loaded both on training and production runs, and the metadata is included in the AOT Cache. But for some reason, none of its methods were profiled during the training run. This means that our training run did not make extensive use of this class. Maybe we should take a look at our training run.
And indeed, there is an obvious mistake: the urls.txt file that oha used to create the requests only contains the static html pages. None of our Java classes are executed, although Quarkus loaded them at the beginning as services.
Let’s run again the training, changing the url to the Java endpoints instead of the html pages: http://localhost:8080/cats and http://localhost:8080/list
Don’t forget to remove the log and aot files from target/ after each try to have clean runs (the clean on the maven command should do that).
If we analyze the results again with our tool, we should see a different result:

We have increased the percentage of the classes used (96%) in production that were cached compared to our last attempt (89%). That’s an improvement.
Did we load all relevant classes during Training?#
Let’s check again for classes loaded in production that were not cached:
Something is still not working as intended. Maybe we should approach this from the other side: are we executing some testing code that replaces the real production code that should be executed during training?
Let’s check if there’s something being stored in the cache that we don’t really need:
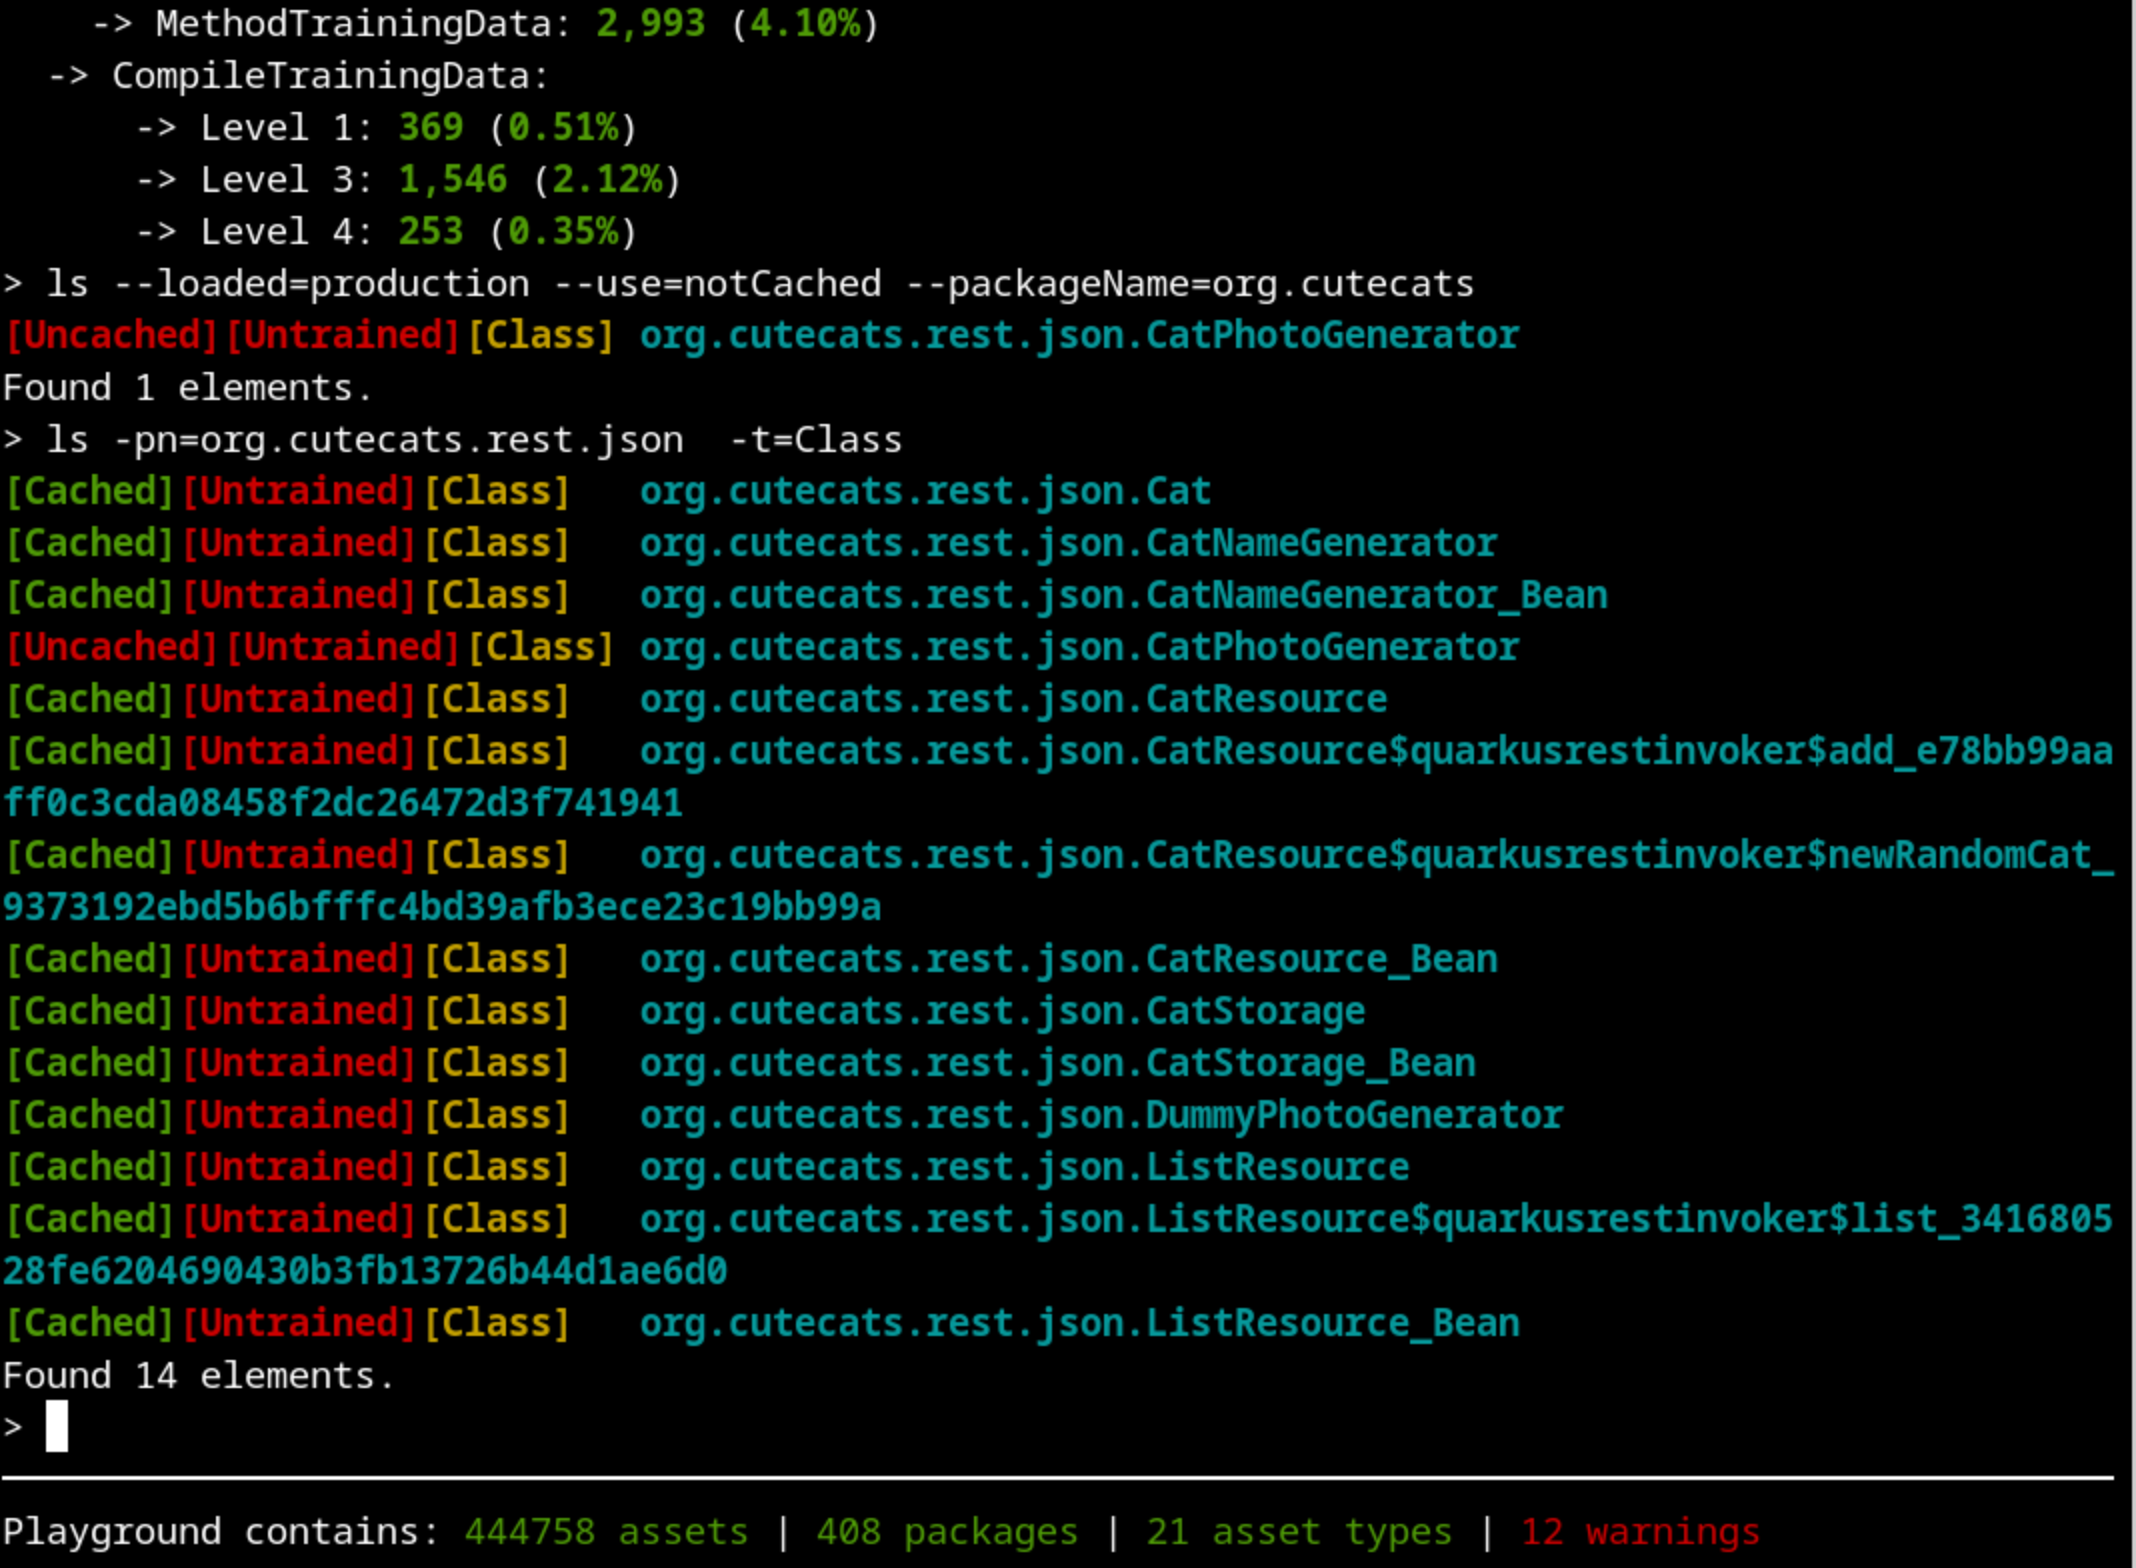
We can see a suspicious class called DummyPhotoGenerator. That’s supposed to be used only for testing purposes, not for real training and production. Using DummyPhotoGenerator instead of the CatPhotoGenerator class is making the code and classes used by CatPhotoGenerator not being used. If we explore our source code, we will discover that there is a “test” argument on the /cats endpoint that distinguishes between testing and production.
To fix our training, we have to call the endpoint /cats with a test=false argument. Because the training run is not a test run.
The training run has to be as close to production as possible. If we use test classes, not only will they be stored in the cache and be loaded on production run, but they may also hide real production code from being trained.
Let’s try again, now using http://localhost:8080/cats?test=false in the urls.txt file.
 We have increased a bit more the percentage of classes loaded, which is always a good sign.
Image description
Do we have any other classes loaded during production that were not cached during training?
Are there any testing classes loaded during training or production runs?
We have increased a bit more the percentage of classes loaded, which is always a good sign.
Image description
Do we have any other classes loaded during production that were not cached during training?
Are there any testing classes loaded during training or production runs?
We made sure that:
Although we still don’t have the aspiring ideal 100% classes cached, we are really close (98%) and we can be happy with the list of classes cached. We can now focus on how good the profiling of the methods is.
Are our methods properly trained?#
Maybe you already noticed another important information we have been ignoring until now: all our classes are labelled as “[Untrained]”. Let’s take a closer look at that.
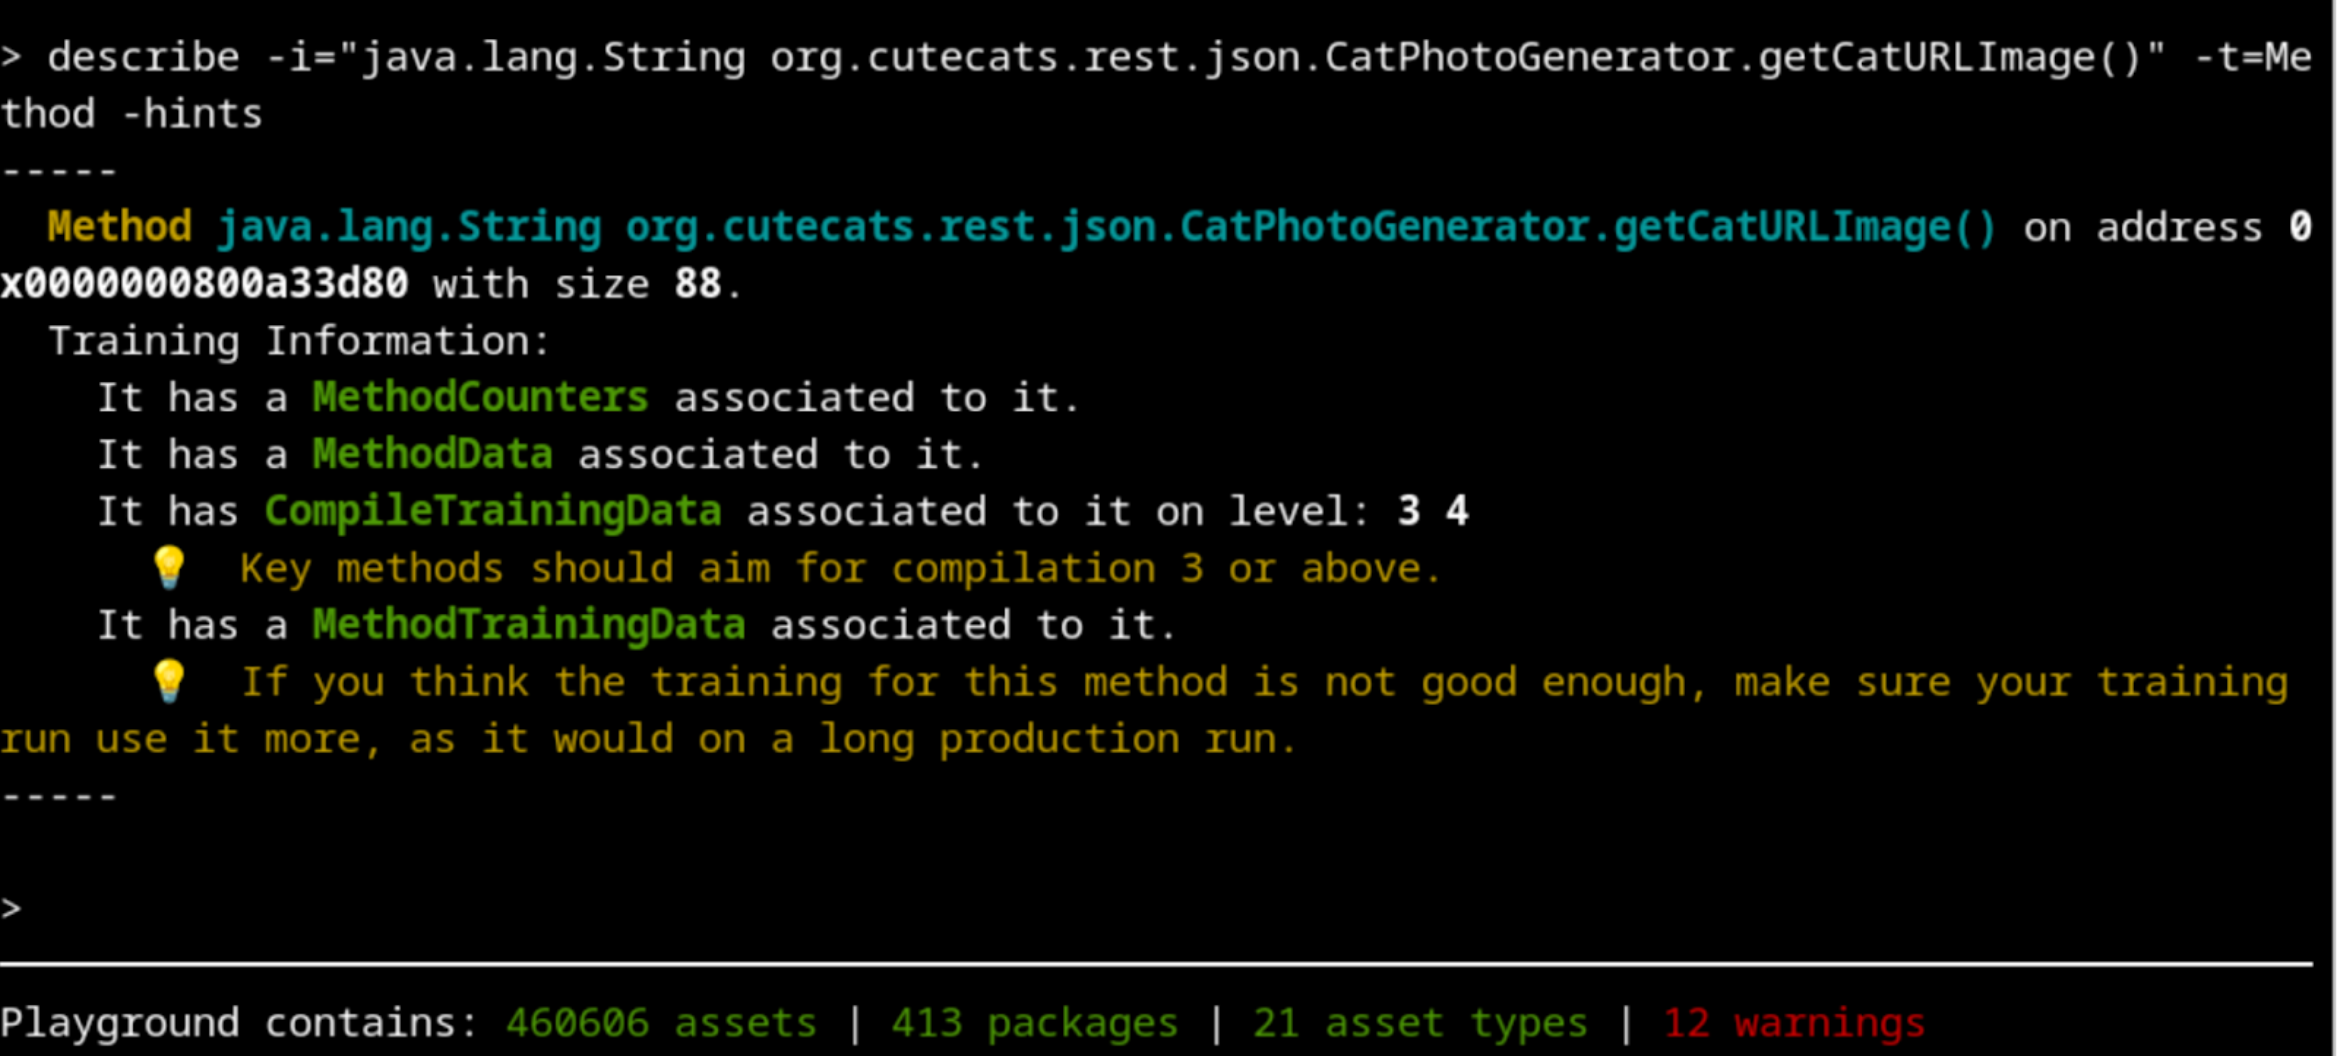
Profiling is done on each method independently, so let’s take a look at one of our methods that we know should be well trained. The describe command is pretty self explanatory on this case:
Let’s follow the recommendation and do more requests during the training run.
$ oha --urls-from-file src/main/resources/urls.txt -n 10k
And with 10 000 requests done, we can see that we got our method completely profiled and compiled to the higher level:
There’s still more improvements that can be done to the training that will greatly depend on your application, but now we have all the basics covered.