In Part 1 of this series of 3 blog posts we introduced the specific performance challenges OpenJDK faces lowering application ‘startup’, ‘warmup’ and ‘initial footprint’ costs and provided an overview of what Leyden is doing to address those challenges.
Part 2 describes how to use the new AOT capabilities offered by Leyden and presents test results which show that very significant progress has already been made and is set to continue.
Part 3 provides a more detailed account of how Leyden’s proposed solution operates, and offers a first look at tooling that allows you to assess the benefits that result and tune your application to make the most of what Leyden offers.
How to use an AOT Cache#
To use an AOT cache (on JDK 25+), you need to add some JVM arguments to your app launch command. There are two ways of doing it, in 2 or 3 steps.
Joint Training and Assembly steps — writing of the AOT cache is performed in a forked Java runtime at training run exit:
- Training+Assembly Run: java -XX:AOTCacheOutput=${aot-cache-file} -jar app.jar
- Production Run: java -XX:AOTCache=${aot-cache-file} -jar app.jar
Step 1 of the two step model runs your application until it exits (whether by means of some exit mechanism built into the application or simply by typing Ctrl-C on the console). At that point a separate Assembly JVM is forked to consume the training data collected during the training run and generate an AOT cache using the name supplied via the AOTCache command line option. The training JVM waits for the Assembly JVM to finish writing this file before it completes its own exit.
Step 2 runs the production application using the AOT cache specified by the AOTCache command line option.
Separate Training and Assembly steps — allows the assembly run to be executed independently without delaying the training run exit:
- Training Run: java - XX:AOTMode=record -XX:AOTConfiguration=${aot-cache-conf-file} -jar app.jar
- Assembly Run: java -XX:AOTMode=create -XX:AOTConfiguration=${aot-cache-conf-file} -XX:AOTCacheOutput=${aot-cache-file} -jar app.jar
- Production Run: java -XX:AOTCache=${aot-cache-file} -jar app.jar
The three step model allows you to manage training and assembly as independent steps.
Step 1 runs your application until it exits, at which the training data collected during the training run is dumped to an AOT configuration file specified using the AOTConfiguration command line option.
In step 2 this training data is passed to a new JVM using the same command line option and is used to generate an AOT cache to the file specified using the AOTCacheOutput command line option.
Step 3 runs the production application using the AOT cache specified by the AOTCache command line option.
The 3 step workflow is sometimes preferable because it allows the training JVM to exit more quickly. Dumping of training data is usually quick even if it is not instantaneous. Generation of the AOT cache takes substantially longer because there is a lot more work involved in sorting and laying out that data in a format that meets the JVM’s needs.
Also, with the Leyden premain release, the Assembly JVM will perform a ‘cleanroom’ compilation of all the methods to be included in the cache, possibly compiling them at more than one compilation level. This adds more time to the cache generation step.
How to properly execute the Training Run?#
The best way to train your application and generate the AOT cache is a canary deployment, where you run your application in the real production environment with training enabled, allowing it to collect training data as it runs. However, that’s not always feasible, especially on containerized production environments that don’t have disk-write privileges.
Depending on how your deployment is set up this may be the type of circumstance where you choose the 3 step training model, allowing your training JVM to exit quickly and relegating the assembly to a separate, follow-on deployment. Note that the assembly JVM does not run your application code so will not need access to resources like networks or databases.
Recording requests made to your application and replaying them on a test server (either in real time or delayed), is also a very good way to generate the AOT cache, as it reproduces exactly the same kind of behaviour you can expect on production. Alternatively, you can generate synthetic request data that simulates the behaviour you expect to encounter in real production, although that may reduce the relevance or accuracy of the resulting AOT cache assets.
If you have a strong testing framework, and you are using Quarkus, you can always generate the AOT cache using integration tests. Note that you will need to run the methods repeatedly (probably several thousands of calls) to generate the proper compilation optimizations.
The best results arise when the raining run resembles a production run as closely as possible. However, whatever training method you employ, on any cache produced will only be usable in production if you run with the same JVM and the same command line JVM options.
You can add extra jars at the end of the production run classpath but the initial segment must be the same as the classpath provided during training.
At the moment of writing this article, you also need to deploy on the same CPU family and operating system. In upcoming versions which will include compiled code in the cache, the production hardware must implement the exact same CPU features as the hardware used for the training run. If the CPU features are not identical then compiled and stub code assets will be ignored (other cache assets will still be usable).
Remember to follow these basic constraints when generating the cache: same hardware, same Java version, same Operating System, and same JVM arguments.
Should I start using AOT Cache in Java already?#
The short answer is yes.
Whether your application gets significantly faster now, or if you are interested in testing it to help Leyden development move towards your interests, you should start using the AOT cache already.
Note that you need at least JDK 25 to be able to use it. Performance gains are incremental with each new JDK release. The actual improvements that you can achieve using Leyden depend strongly on your application and how you use it.
Let’s see some examples. We are going to run them over JDK 26.
Heavy Mathematical Example#
First we are going to use a benchmark application that runs heavy mathematical operations via a REST API. We are going to train this application twice to compare how different training affects performance on production.
This application makes use of an aot-jar from Quarkus which is optimized for Leyden and available since version 3.32.0.
We are going to use a training run that randomly calls the following urls:
- /nqueens/16 : to calculate the nqueens problem with a 16 board size
- /fibonacci/100 : to calculate fibonacci series with input 100
- /nqueens : to calculate the nqueens problem with either 16 or 8 as the board size
- /fibonacci : to calculate fibonacci with a random number between 1 and 100
The idea is to have a load that is partly random (as an API with real users would be) but has a preference over specific branches or loop unrolling sizes.
We will do a training with 1000 requests and a second training with 60 000 requests. That should represent how different training affects final performance. We are going to run the application on a Linux machine assigning 2 cores to our application.
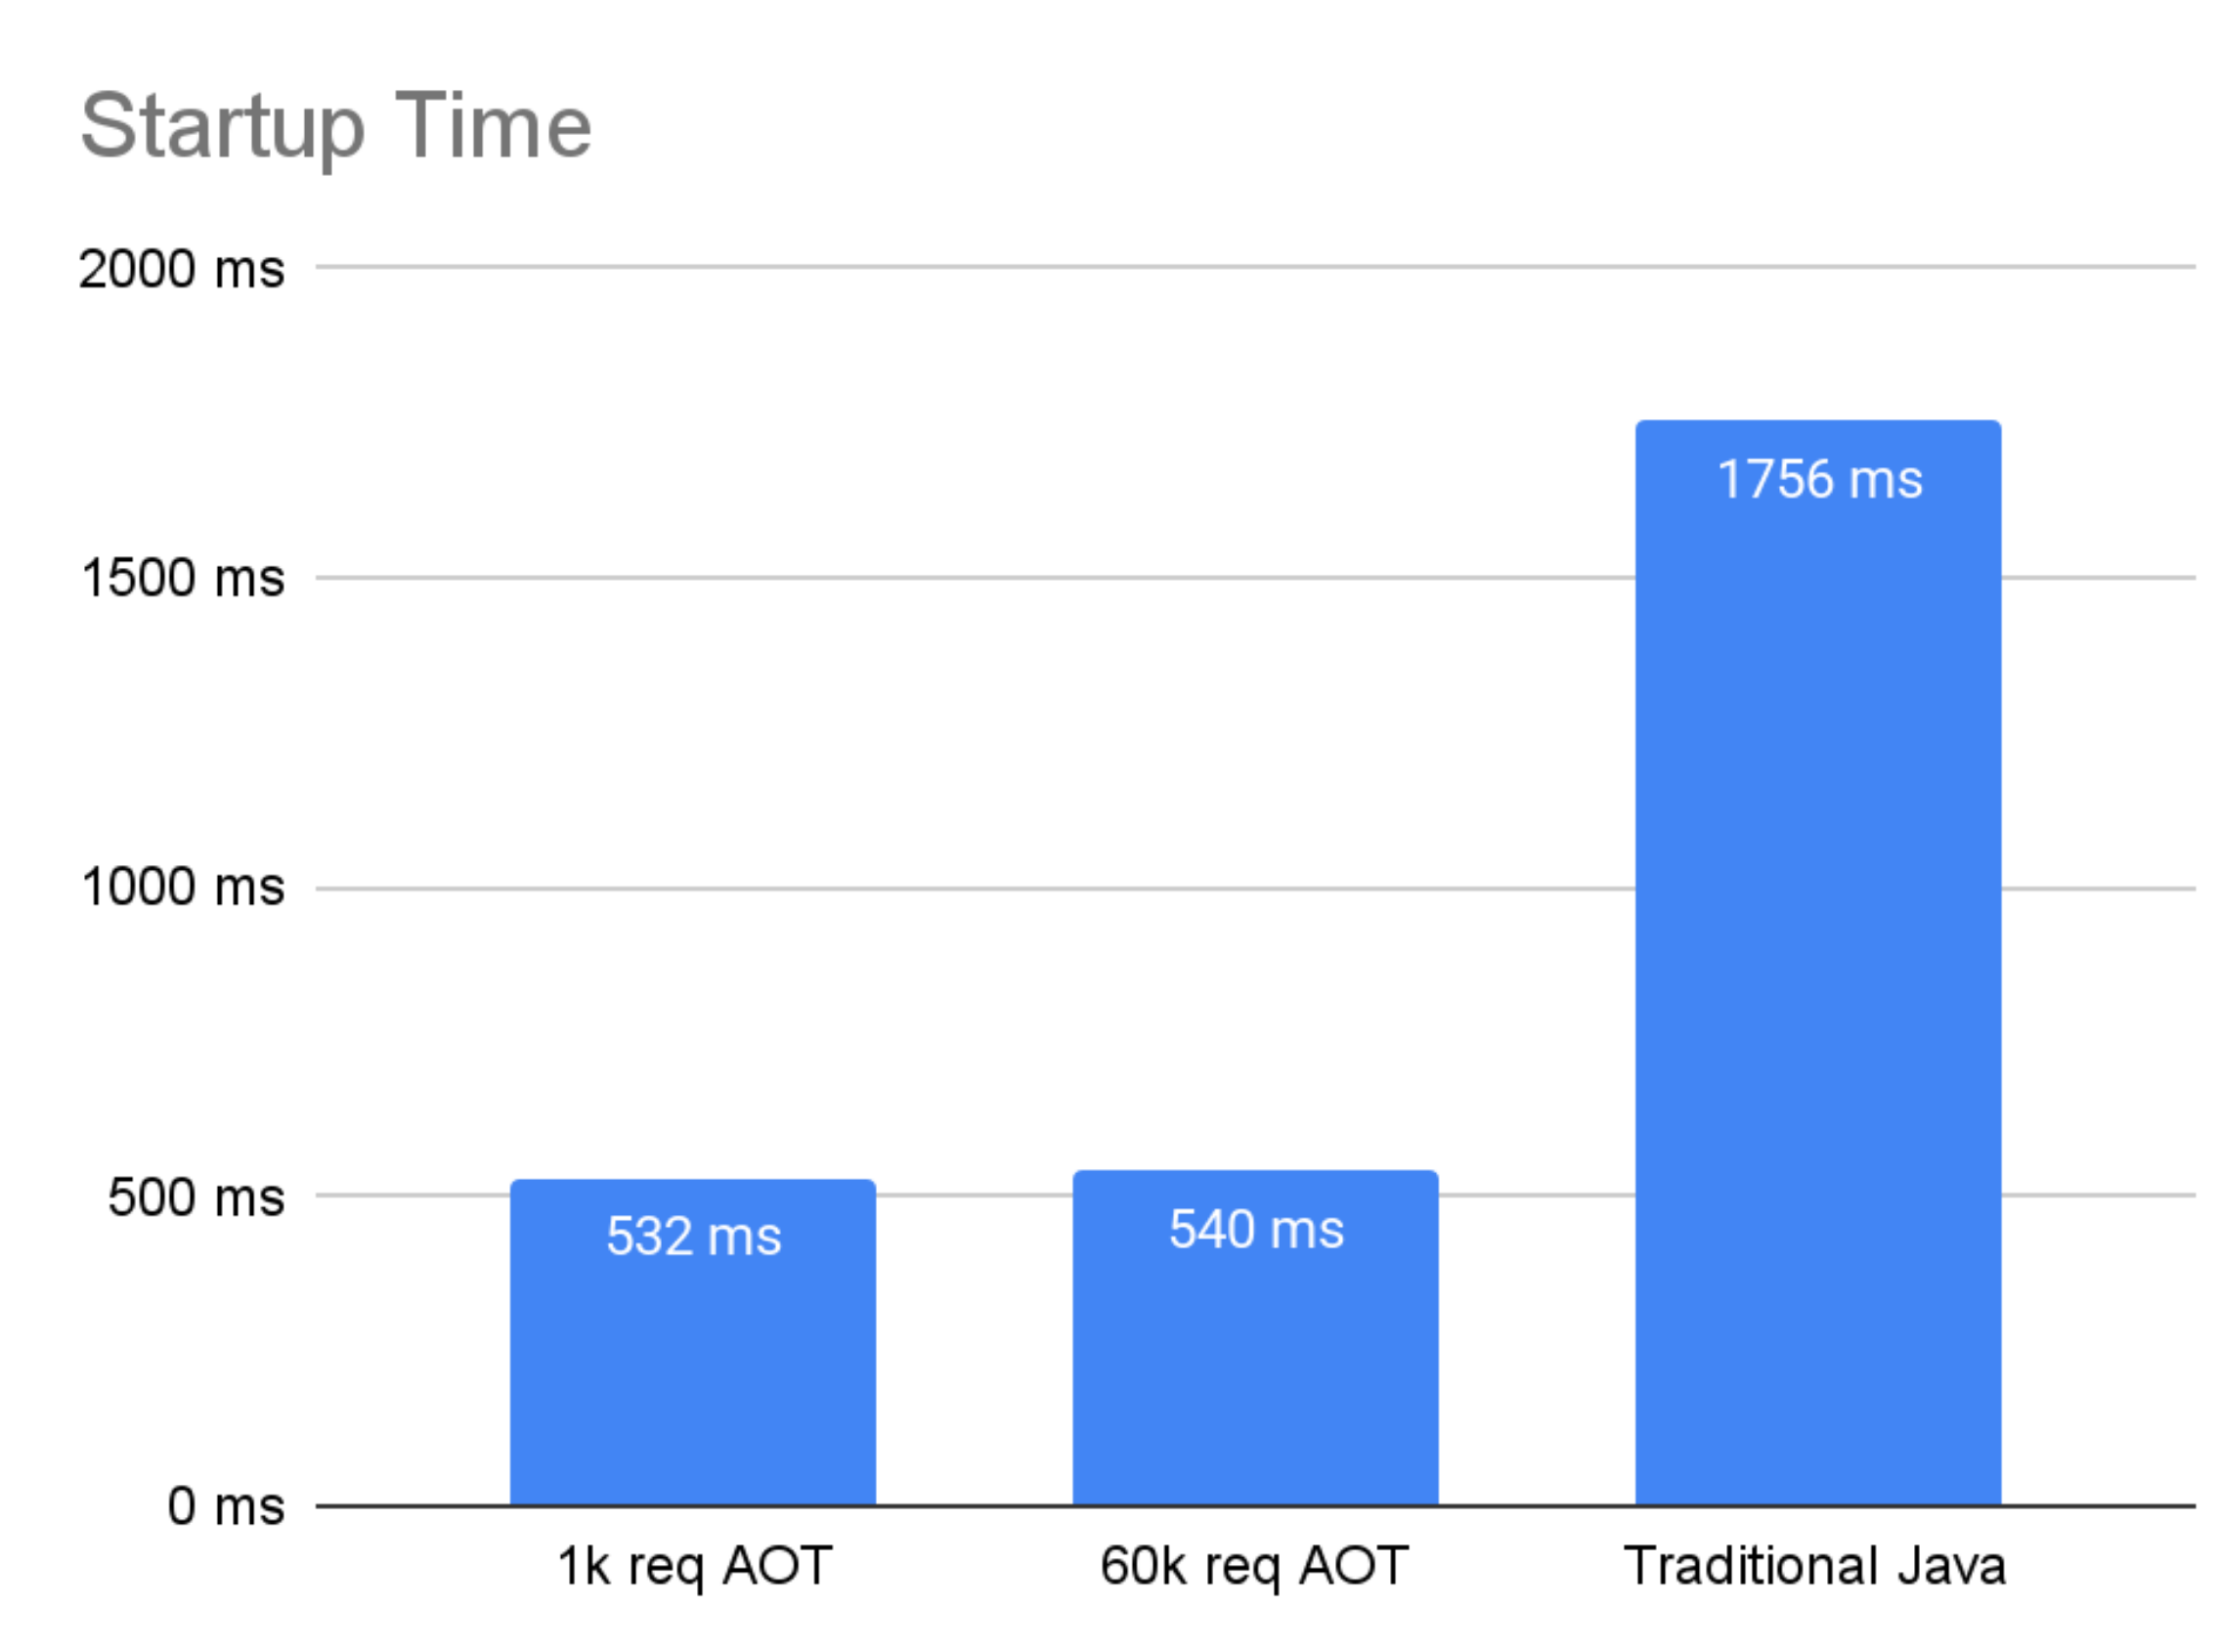
Due to the kind of things Java 26 is storing in the AOT cache, we can theorize that there won’t be much difference between the different trainings when comparing startup time (startup of the application and opening the port), as most of the code run during initialization is run only once, so adding more requests to the training won’t improve that initialization time. This is something that may change in future developments as more assets are included in the AOT cache.
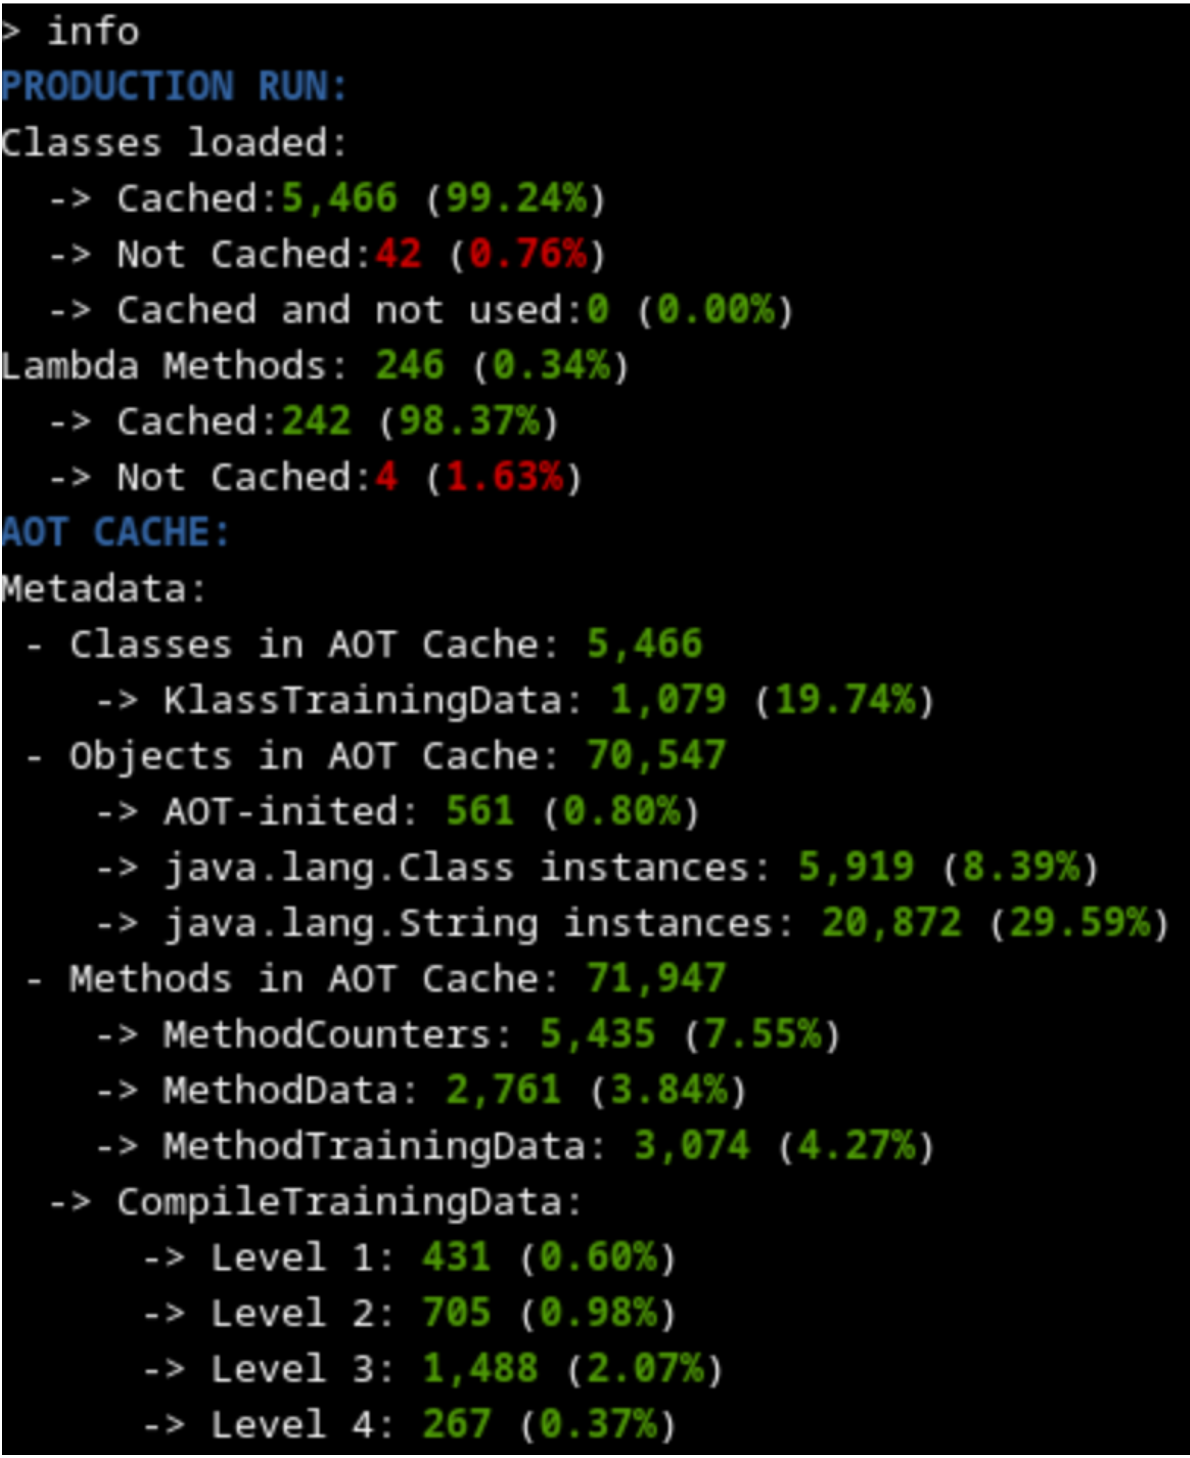
By using the Java AOT Cache Diagnostics Tool, we can compare the contents of the cache generated on each training.
| 1000 requests training |
60 000 requests training |
 |
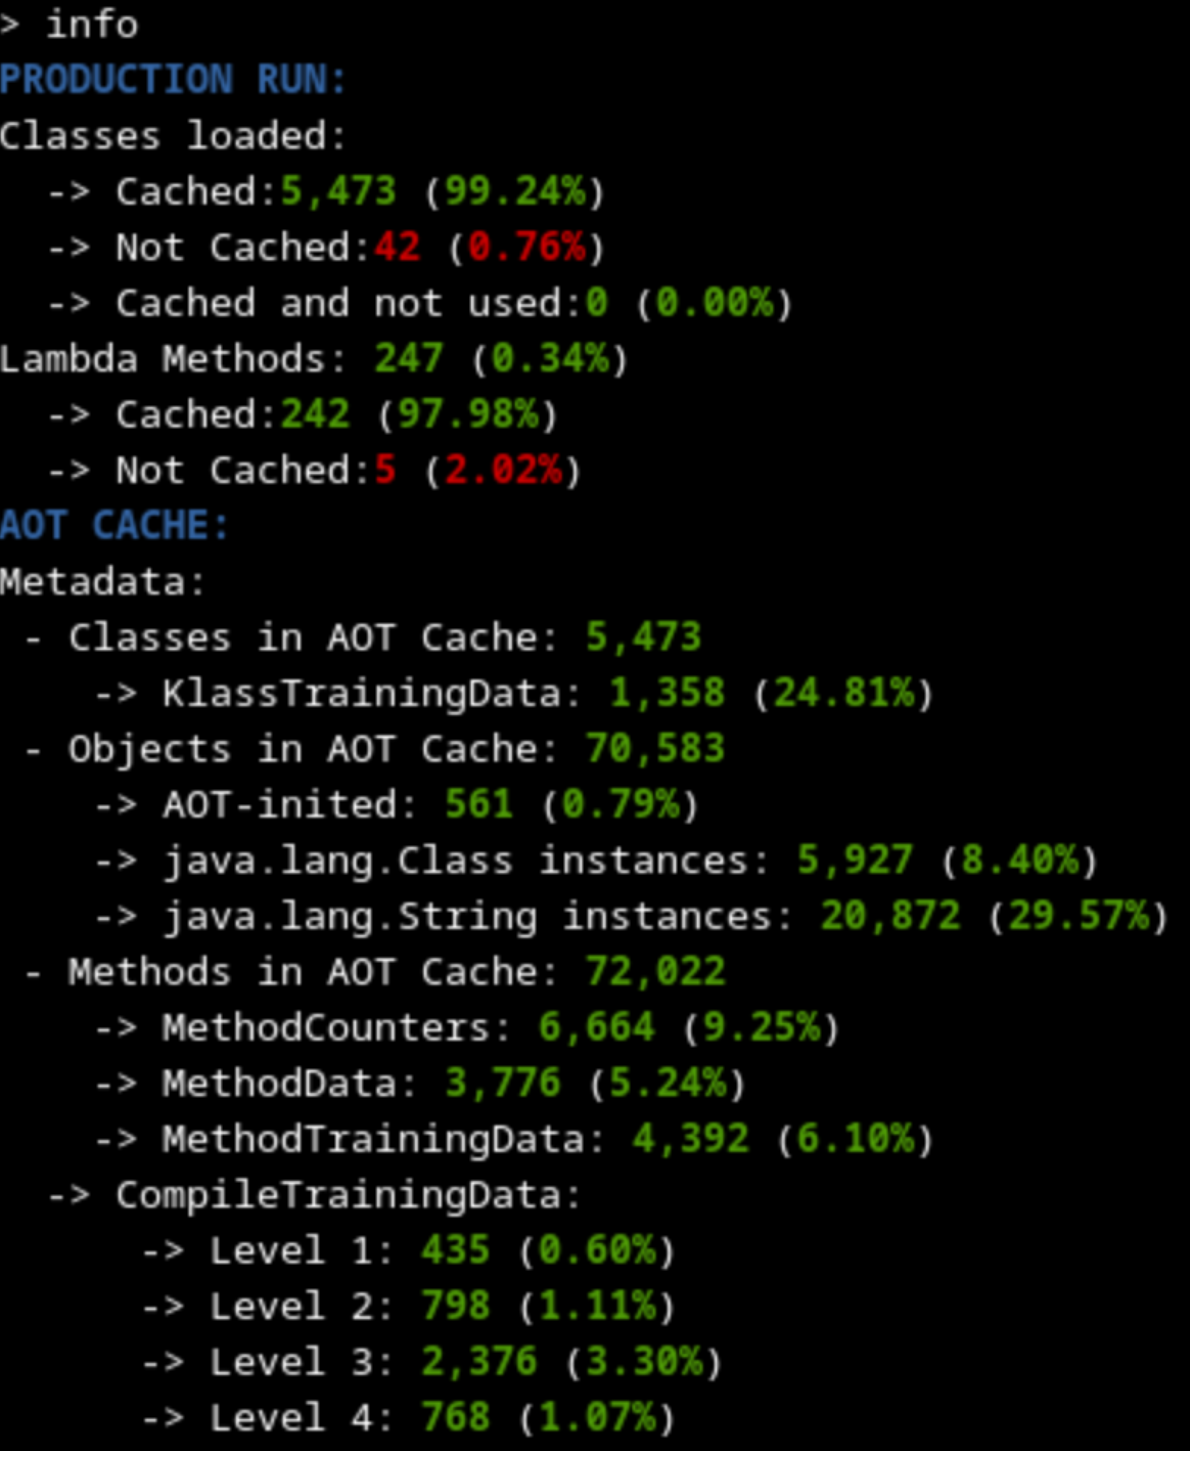 |
As expected, both trainings seem to have cached the same amount of metadata (slightly above 99% of classes used), because the code loaded into memory on both cases should be more or less the same (some timeout or runtime exception thrown may explain differences). This means that the startup time using any of the generated caches should be similar.
The training with 60 000 requests has many more methods that are profiled and compiled at a higher level because it had a longer time to profile and optimize. That should lead to better outcomes on the warmup time.
Anyway, we should notice an improvement on startup time compared to the regular Java deployment, because we have a lot of metadata, profile and linkage data and some heap data already cached during AOT. And as we can see on the following graph, time to first response (which includes initialization) is already cut in half.
The other interesting measurement is how much and for how long response times are disrupted during the early stages of application execution. There is always some small variation in response times even when an app is fully warmed up – often referred to as jitter.
However, during warmup the housekeeping work that the JVM has to do can significantly increase jitter. Individual responses may be delayed because they require the thread to execute one-off events like load or initialize a class, link a call site or field access site, or update profile data. Background JIT compilation will also steal CPU cycles, potentially pre-empting request handling in Java threads. Finally, early requests will mostly execute relatively slowly in the interpreter, while later requests will gradually respond more quickly as the JIT compiler delivers compiled code.
In theory, this is where longer training sessions should have a bigger impact. Better training results in more cached classes and heap objects needed in production, more pre-linking of calls and accesses, more method profile data to allow earlier and better informed compilation. So, we should see not only an improvement compared to the regular java version, but also a difference between the two trained caches.
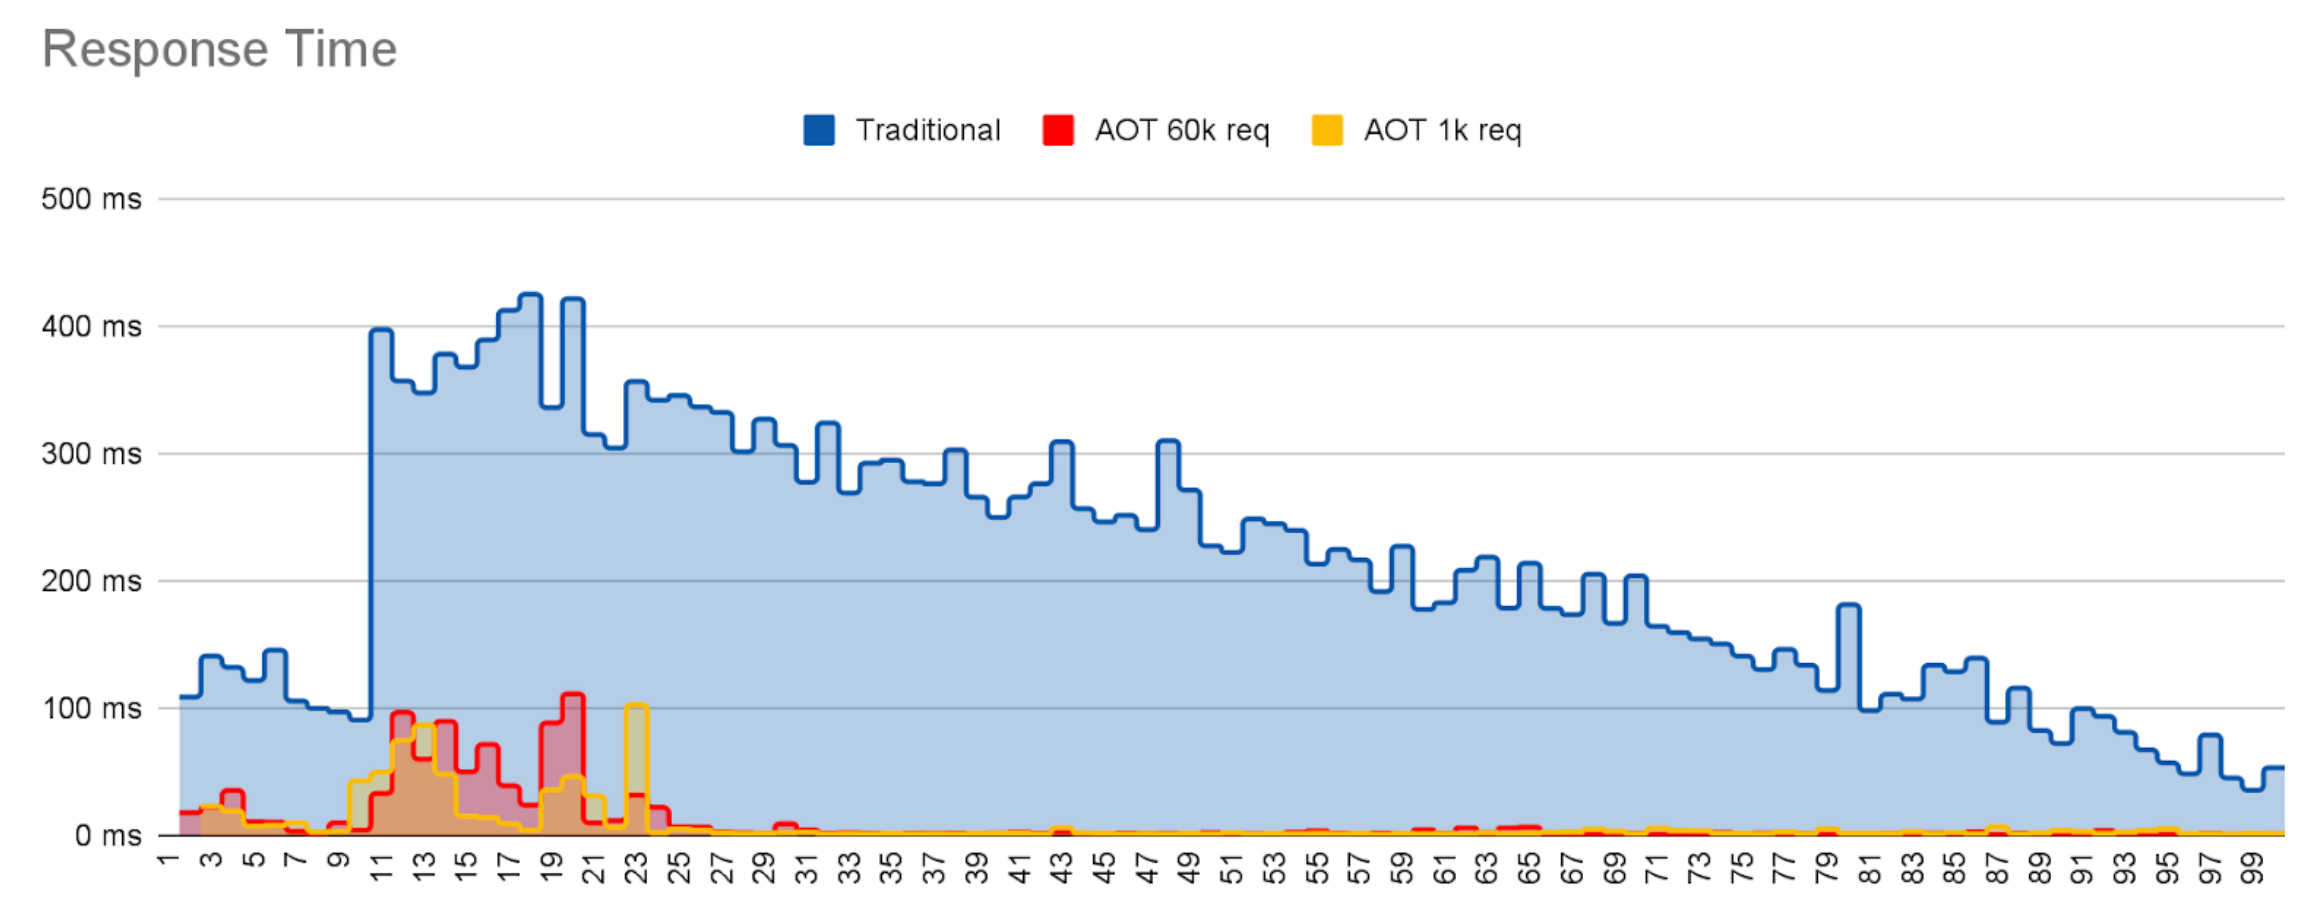
The graph above shows individual response times for requests for each of the three deployments, Traditional Java (no AOT), AOT trained with 1000 requests, and AOT trained with 60 000 requests.
In all cases, the request rate is constant and within the peak capacity of the server. In all 3 cases the jitter slowly decays as the request count increases, eventually converging to a low, random variation.
However, it is also very clear that
- There is a lot more JVM housework being performed in the non-AOT case than when using AOT, reaching peak performance later.
- The well trained cache suffers less jitter, i.e. removes a lot more housework, than the weakly trained app.
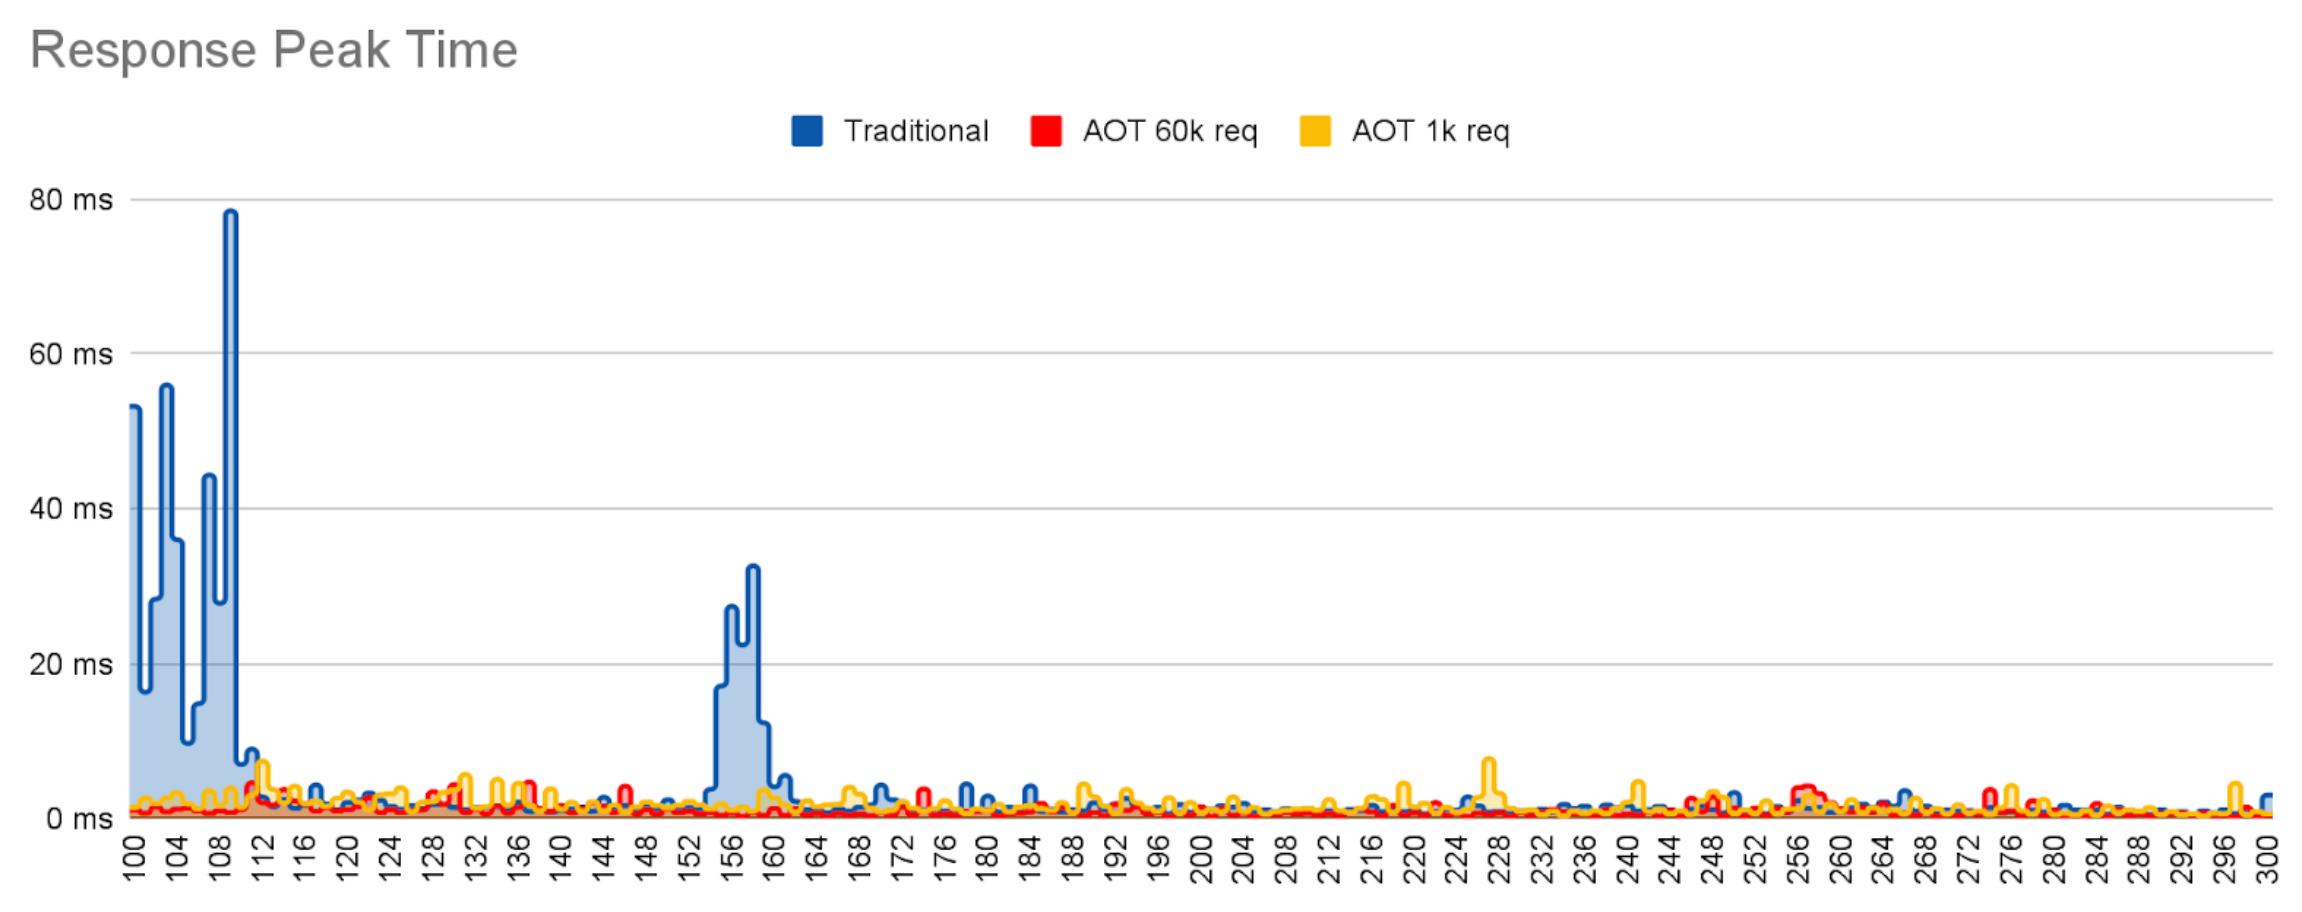
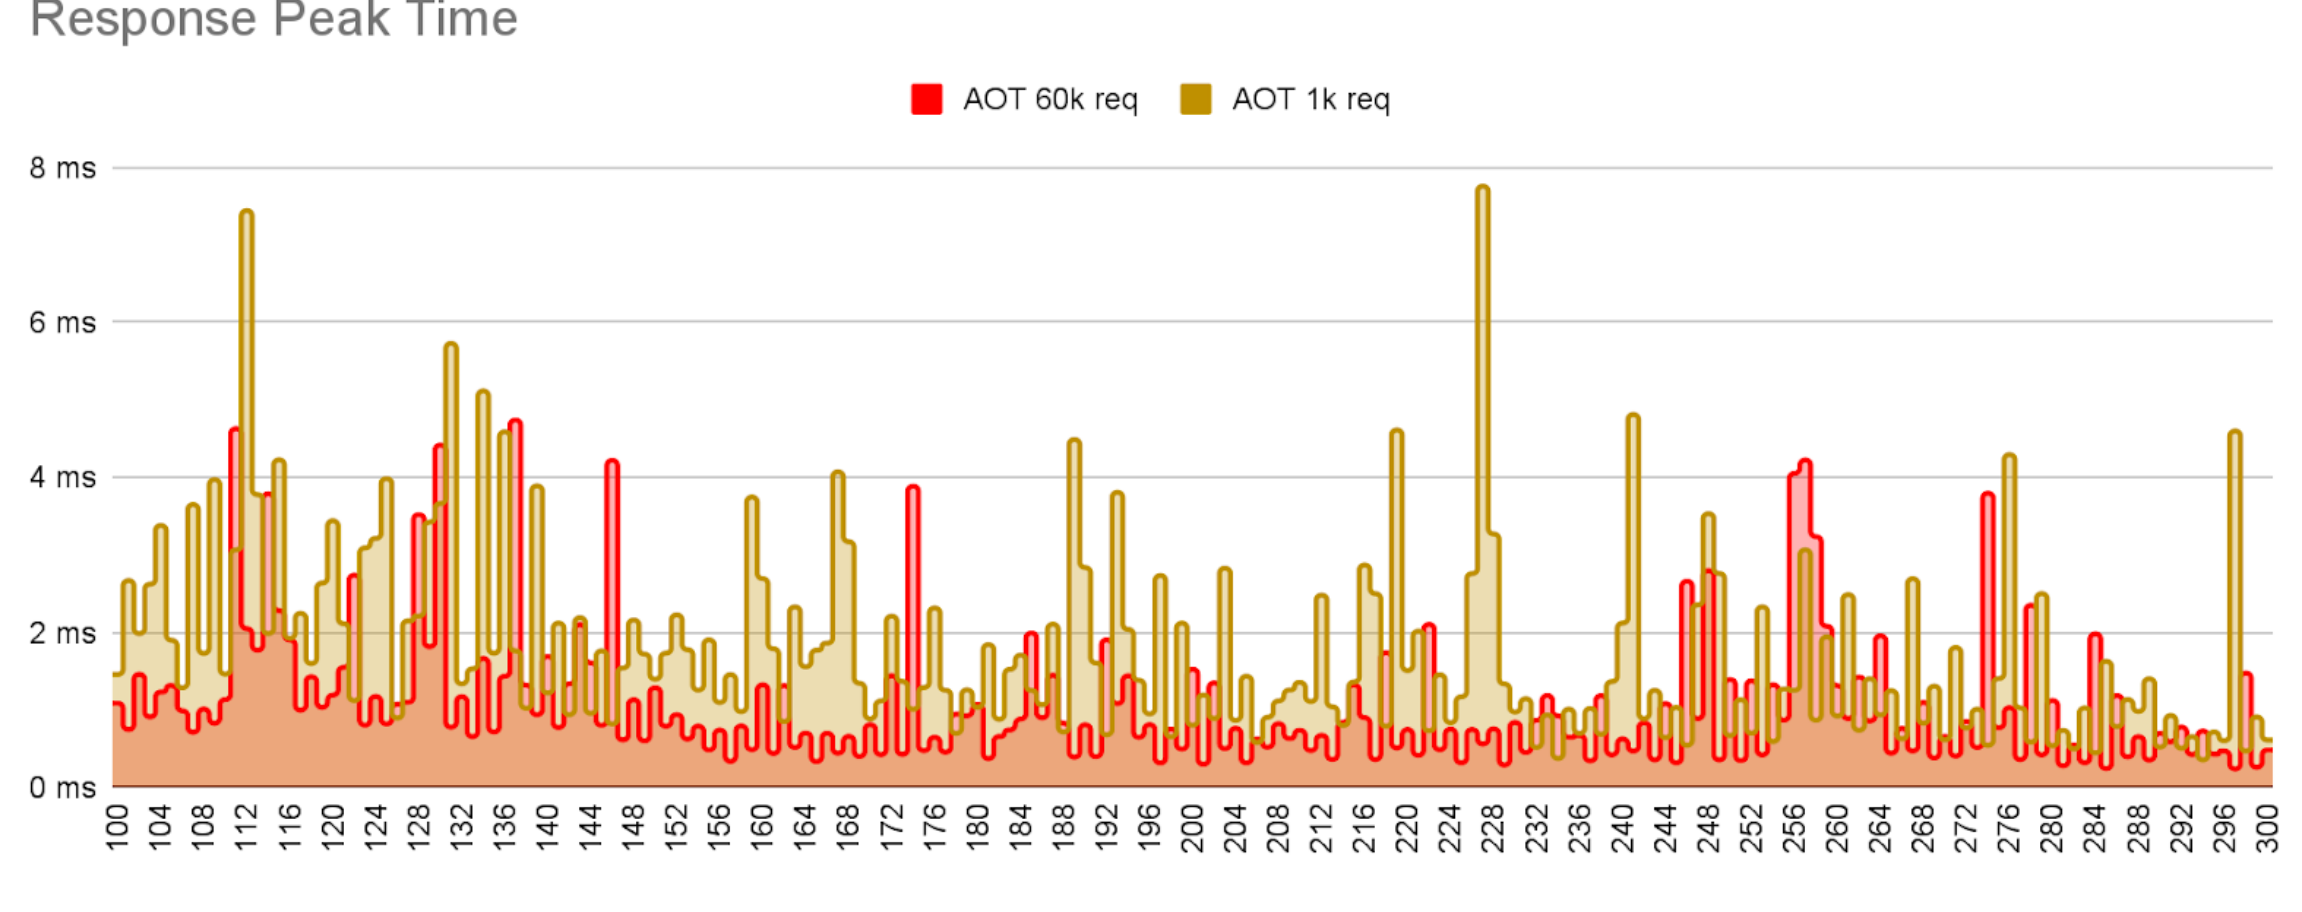
Note that JDK26 does store training data on the cache, but does not store compiled code. This means, future versions of the JDK will show a much larger difference between weak and strong training regimes.
Simple REST API#
Now, we are going to do the same with a simple REST API application using Quarkus that connects to a database to extract data. This time we employ the Leyden premain JVM which caches code compiled code as well as all the other AOT cache assets mentioned earlier.
We use a single training run with 10 000 requests, executing a test that calls the endpoint /fruits repeatedly. In contrast with the previous example, in this case we are not going to observe as much advantage from speculative compilation because the code is simpler and the entrypoint is always called with the same parameters. But we should still see an improvement all the same.
Let’s take a look at the time to first response to see if it is improved by Leyden AOT:
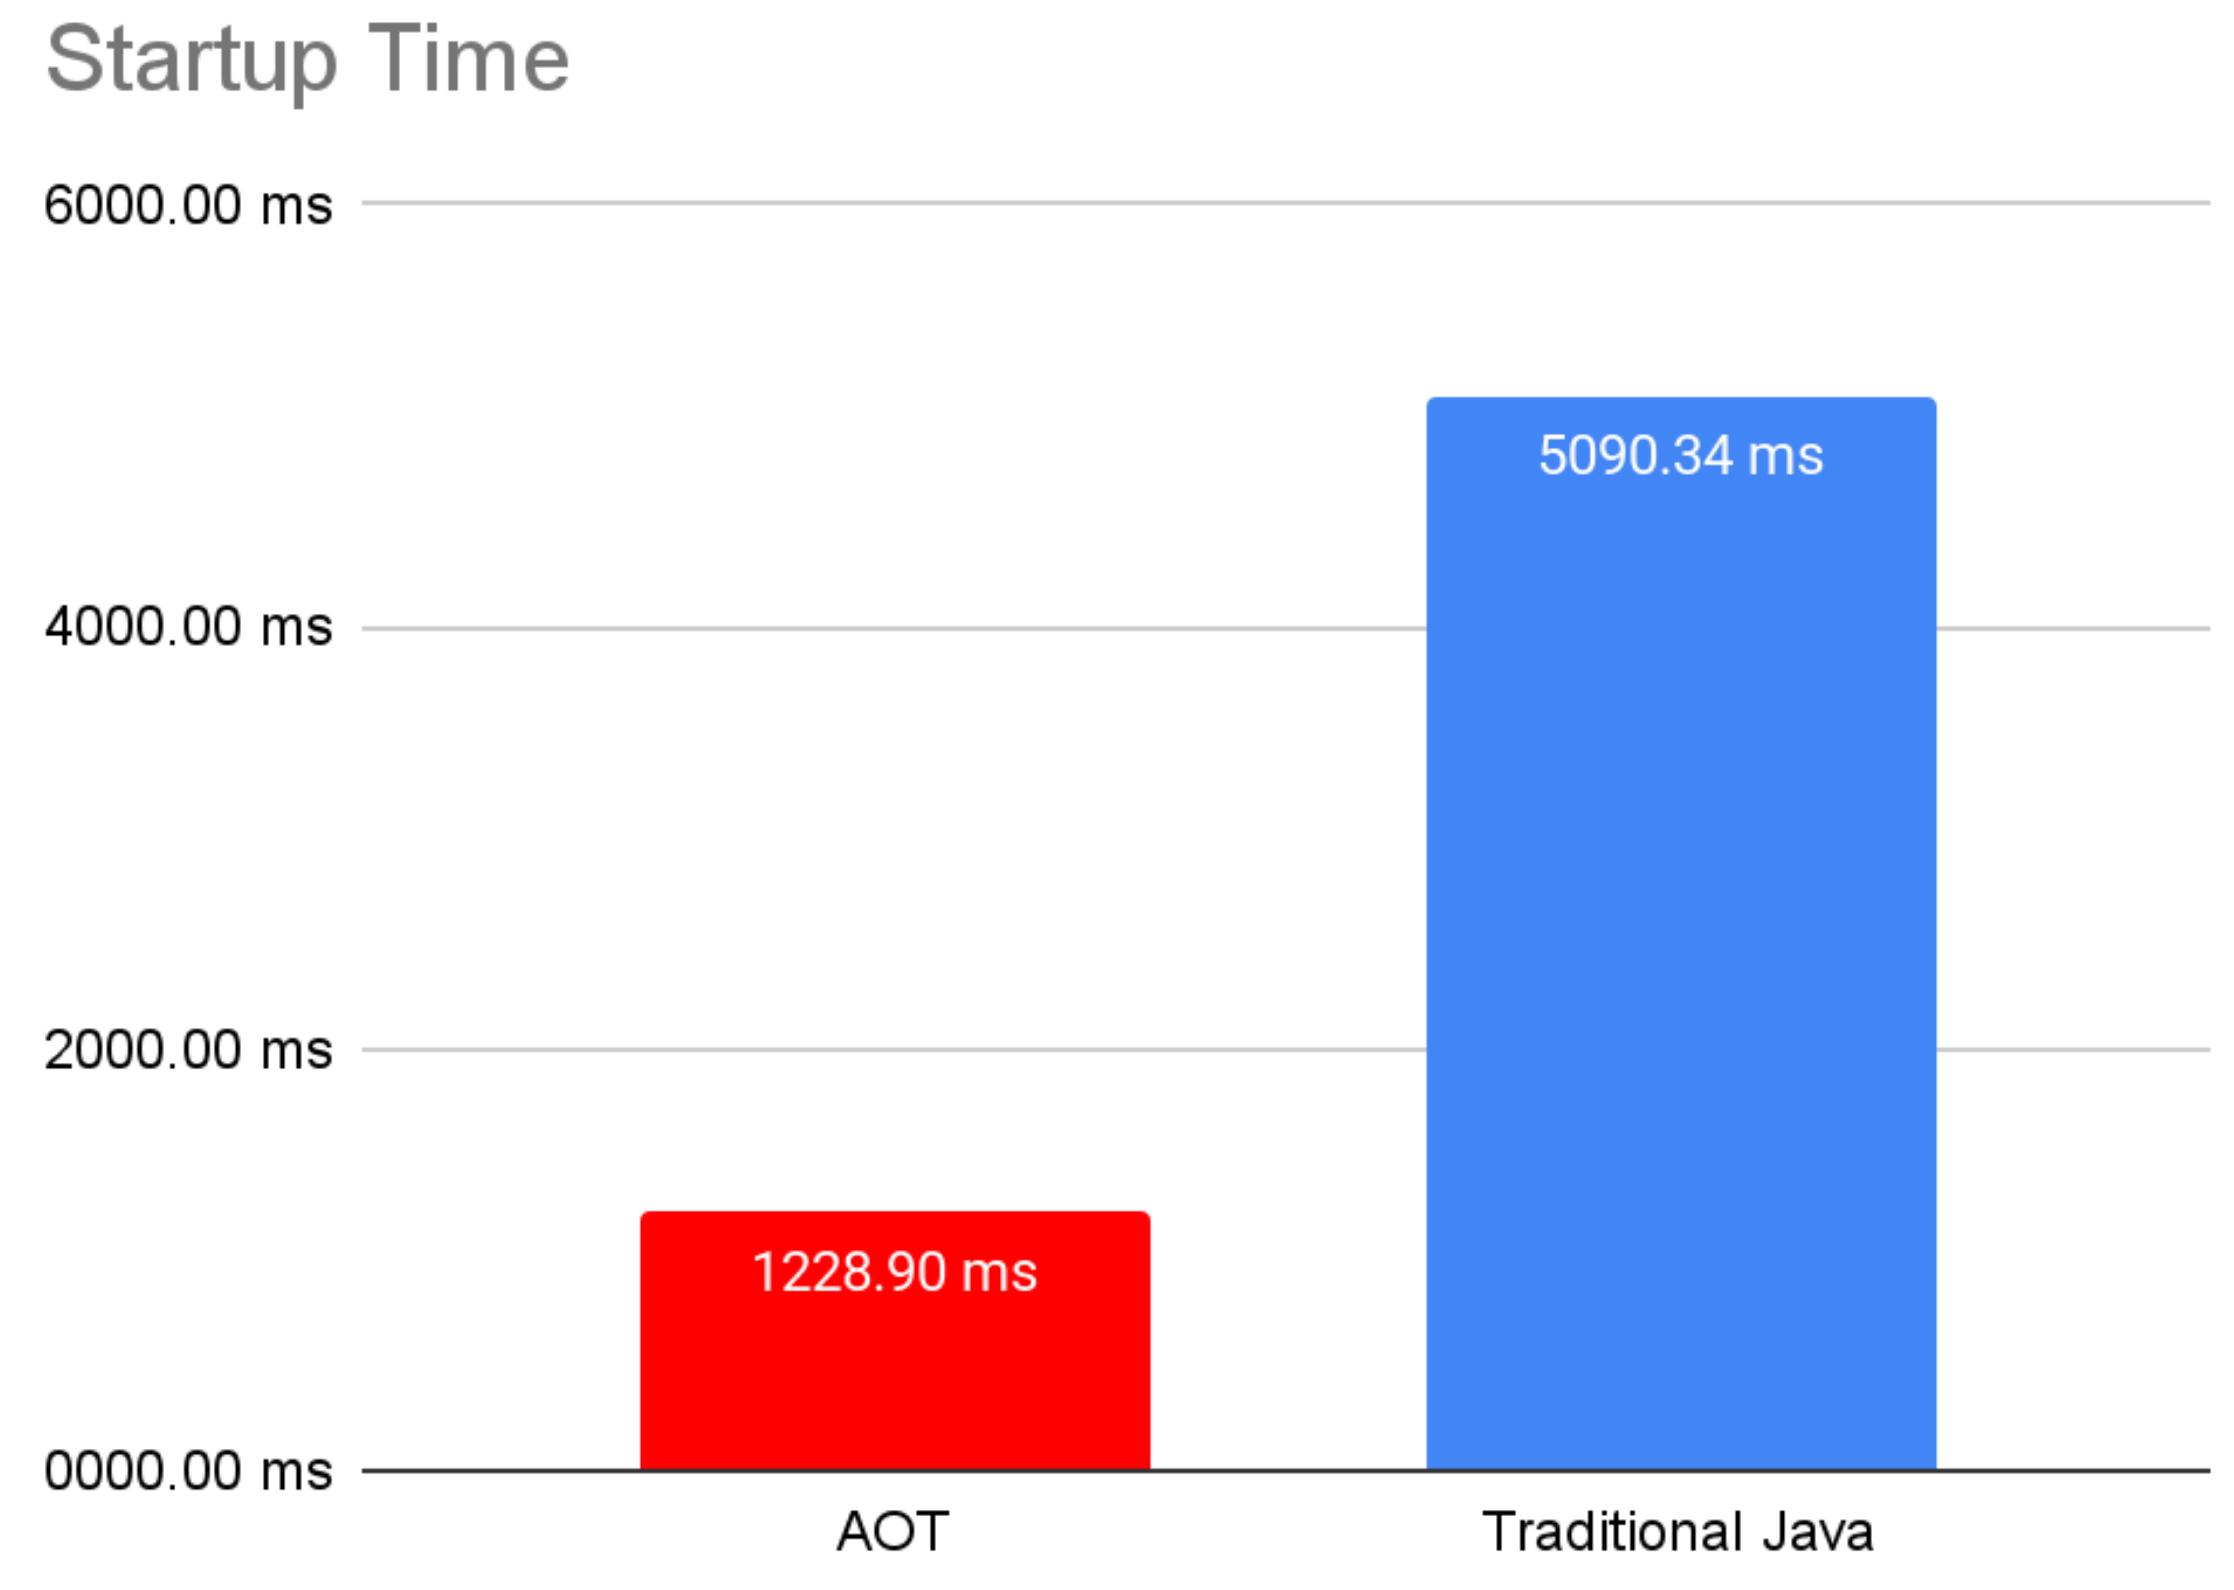
Startup time in this example is slower than in the previous example because we have to initialize connections to the database and load the database model.
Now, let’s take a look at the response times and see if the warmup time is also improved thanks to the AOT cache.
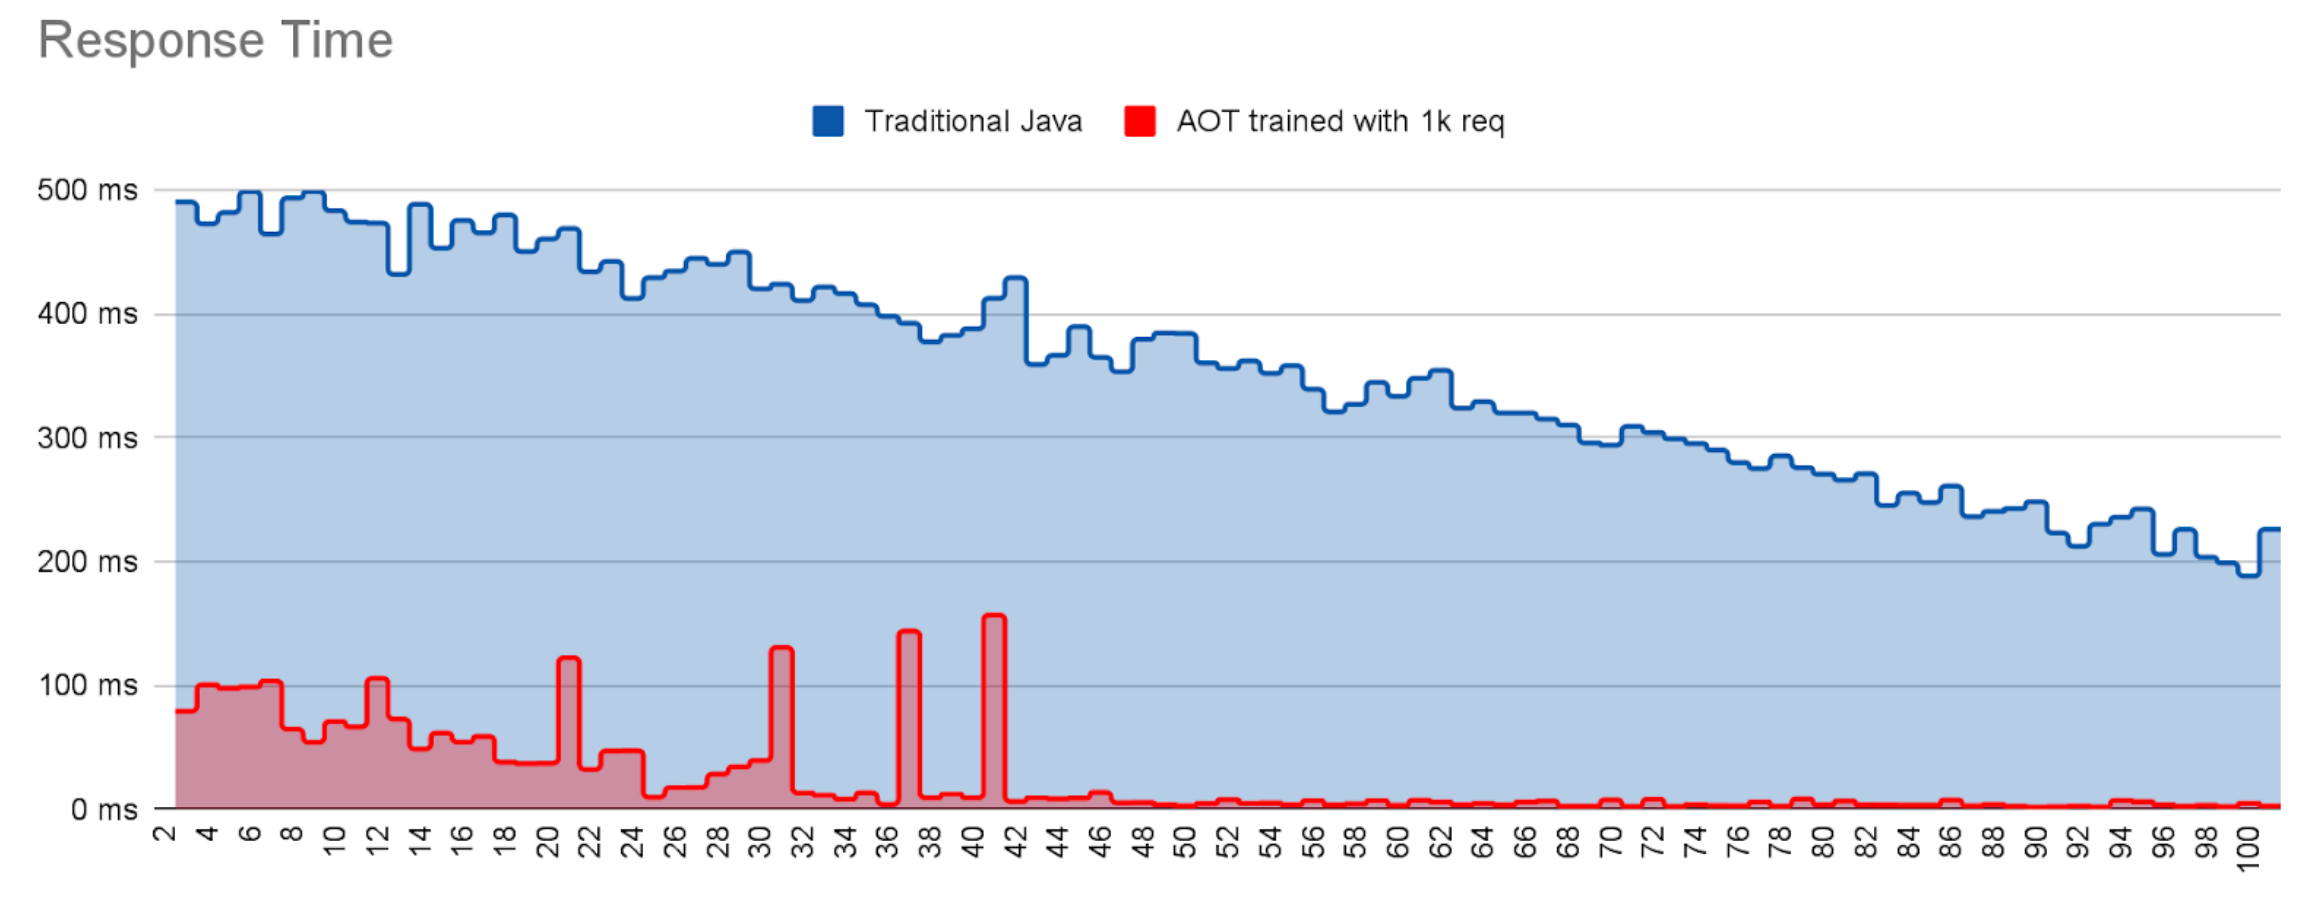
Both runs suffer jitter during the first requests, at which point most of the housekeeping work is completed. The dramatic drop off in jitter for the AOT run around request 45 indicates that at this point almost all loading, initialization and linking costs have been met and the necessary compiled code has been delivered. By contrast the non-AOT run is still suffering jitter even after 100 requests i.e. it has still not warmed up to reach peak performance.
These are only a couple of examples that showcase how Leyden is already improving your startup and warmup time.
How far Leyden can help your application can only be discovered by trying it.